Fig. 3
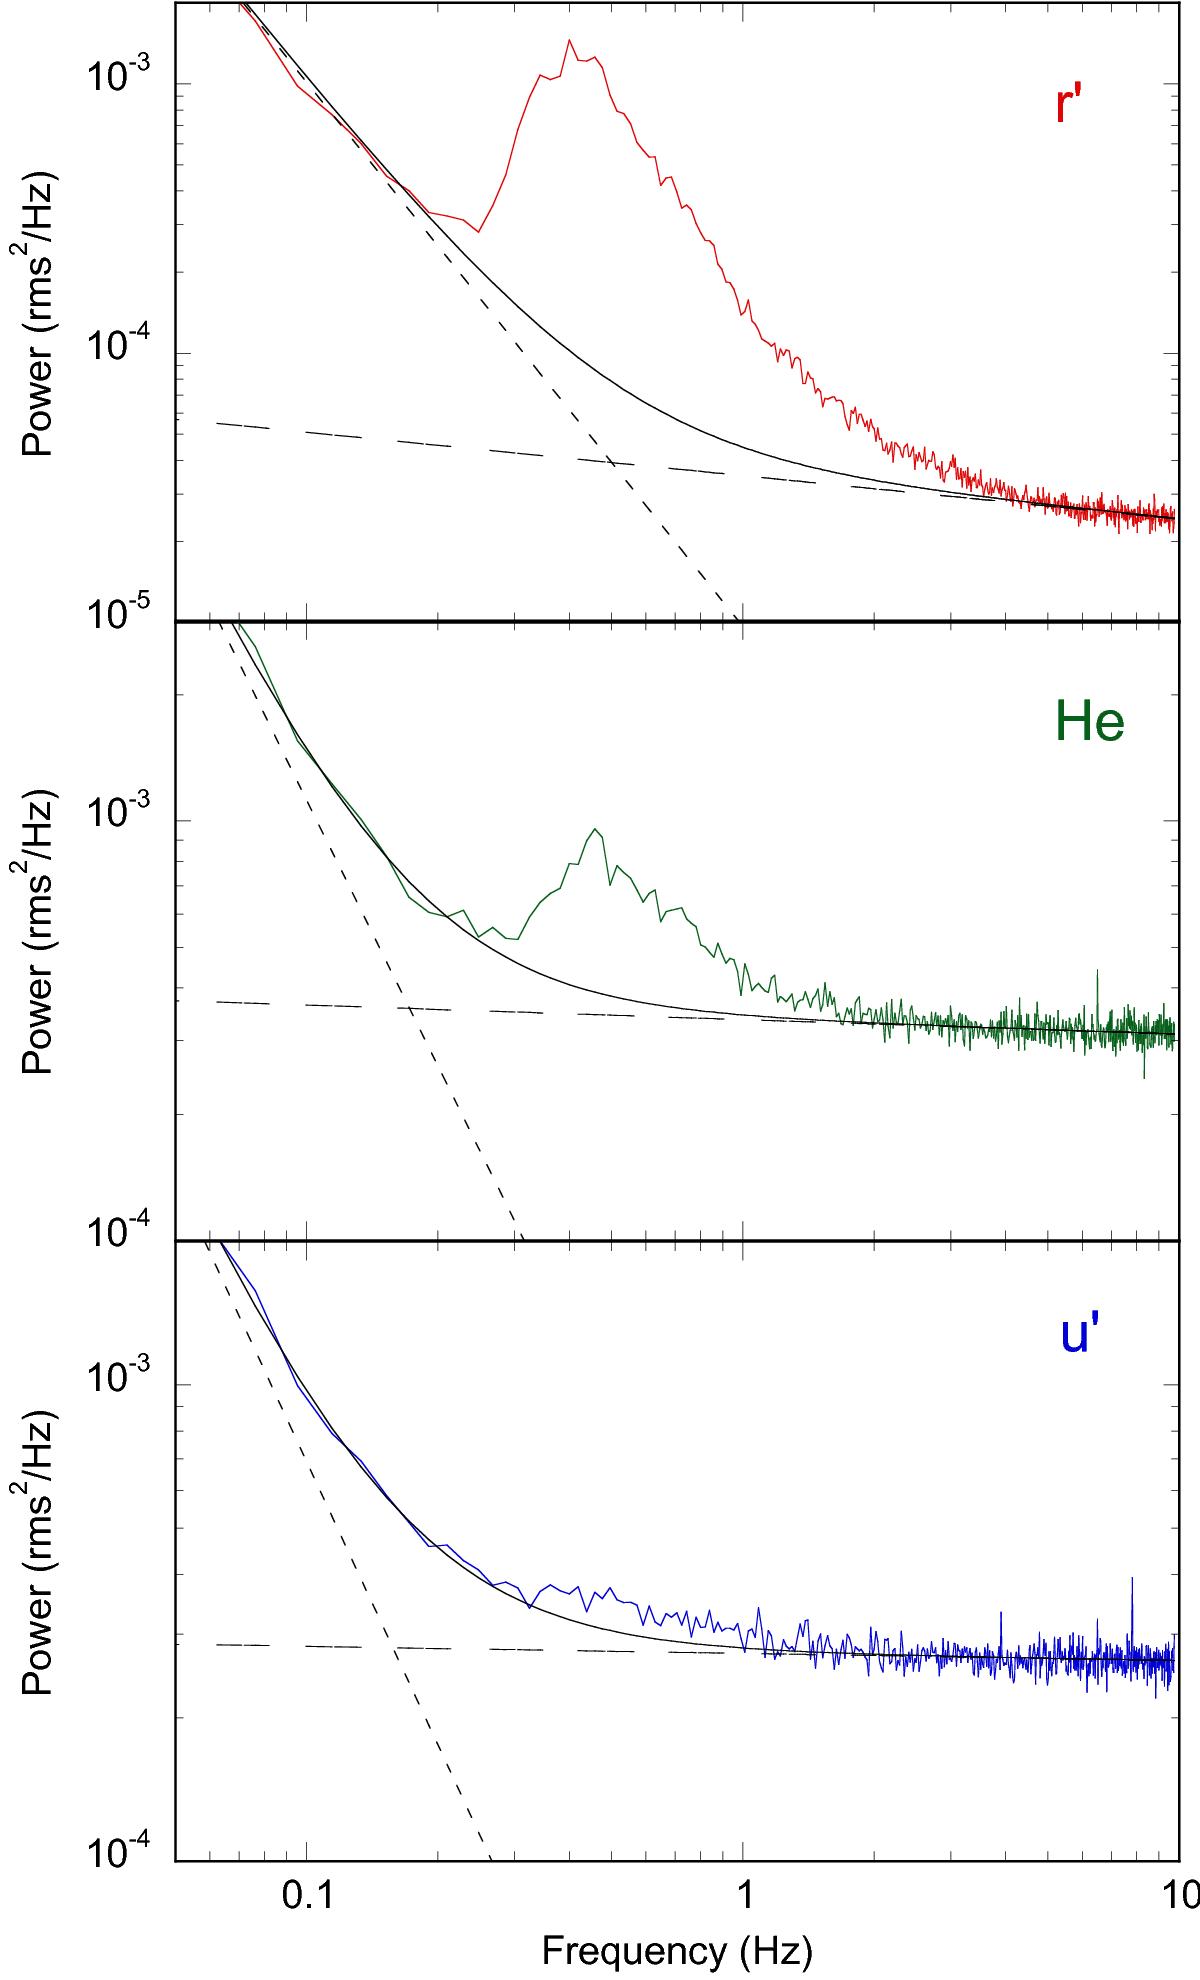
QPO frequency profiles. Mean power density spectra of the three light curves (top: r′, middle: He, bottom: u′) for the full ~5.6 h observation are shown in logarithmic scale in the range 0.03−9.76 Hz. The Y scale is the squared fractional amplitude in units of rms2 Hz-1. Two best fit power laws are shown representing the additional low-frequency red noise (dotted line) and high-frequency white noise (dashed line); their sum (full line) has been subtracted to compute the QPO power (see text).
Current usage metrics show cumulative count of Article Views (full-text article views including HTML views, PDF and ePub downloads, according to the available data) and Abstracts Views on Vision4Press platform.
Data correspond to usage on the plateform after 2015. The current usage metrics is available 48-96 hours after online publication and is updated daily on week days.
Initial download of the metrics may take a while.