Fig. 15
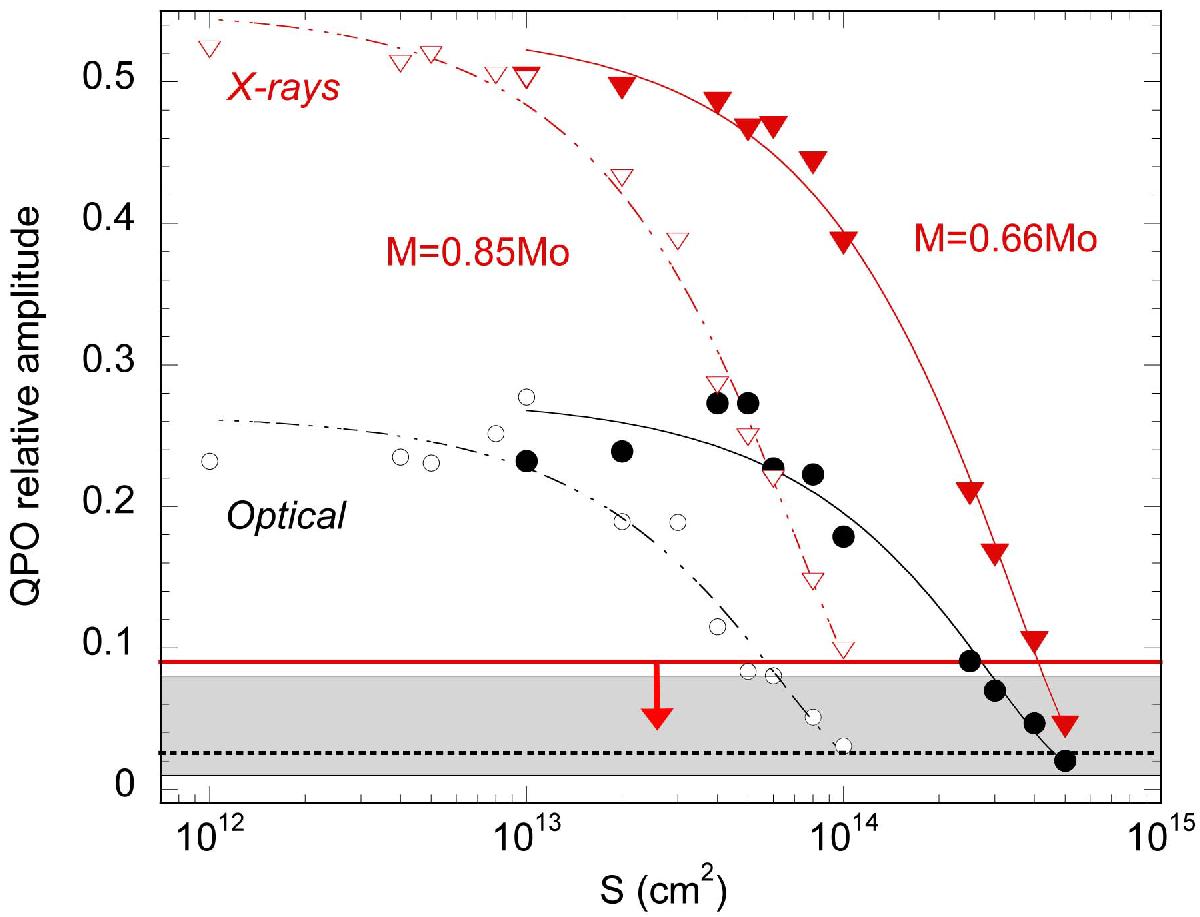
QPO amplitudes from RAMSES numerical simulations. QPO relative amplitudes in X-ray (0.5−10 keV) bremsstrahlung (in red) and optical cyclotron (in black) are shown for two different masses MWD = 0.66 M⊙ (filled symbols) and 0.85 M⊙ (open symbols) as a function of the column cross section. Full and dotted lines are polynomial fits to the data points. Also shown as horizontal lines are the observed upper limit in X-rays (red line) and the mean optical amplitude (dotted line) and range (shaded area) from the present observations.
Current usage metrics show cumulative count of Article Views (full-text article views including HTML views, PDF and ePub downloads, according to the available data) and Abstracts Views on Vision4Press platform.
Data correspond to usage on the plateform after 2015. The current usage metrics is available 48-96 hours after online publication and is updated daily on week days.
Initial download of the metrics may take a while.