Fig. 13
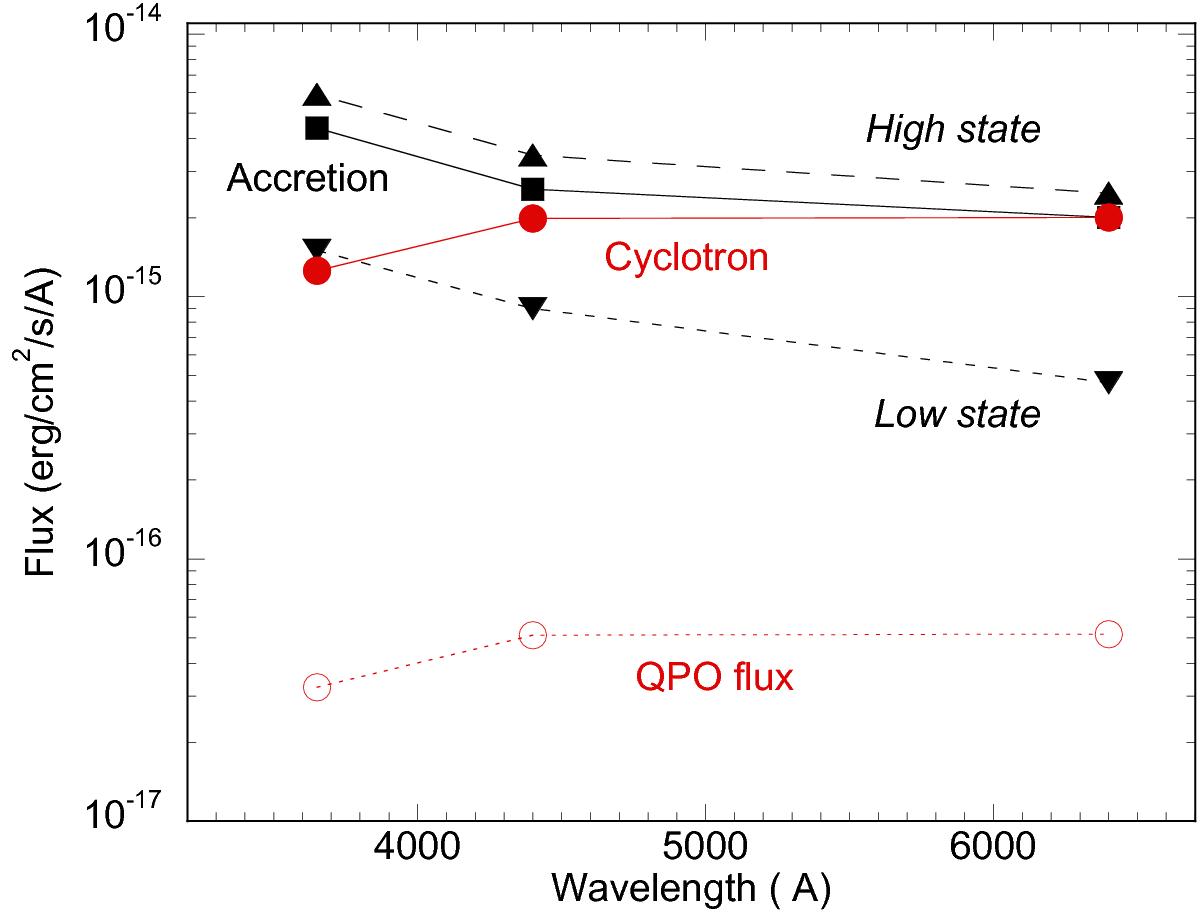
Time-averaged spectral distribution of the QPO and continuum flux for V834 Cen. The high-state level (up-pointing triangles) is from Middleditch et al. (1991) and low-state level (down-pointing triangles) from Puchnarewicz et al. (1990). The difference (high-low) state (black squares) is assumed to be the accretion flux. Also shown are the measured QPO flux (open red circles) and the cyclotron flux (filled red circles) reconstructed from the QPO amplitude, assuming a constant fraction of the cyclotron flux as expected from the models (see text). Note that there is a large difference in the u′ filter when compared to the accretion flux.
Current usage metrics show cumulative count of Article Views (full-text article views including HTML views, PDF and ePub downloads, according to the available data) and Abstracts Views on Vision4Press platform.
Data correspond to usage on the plateform after 2015. The current usage metrics is available 48-96 hours after online publication and is updated daily on week days.
Initial download of the metrics may take a while.