Fig. 12
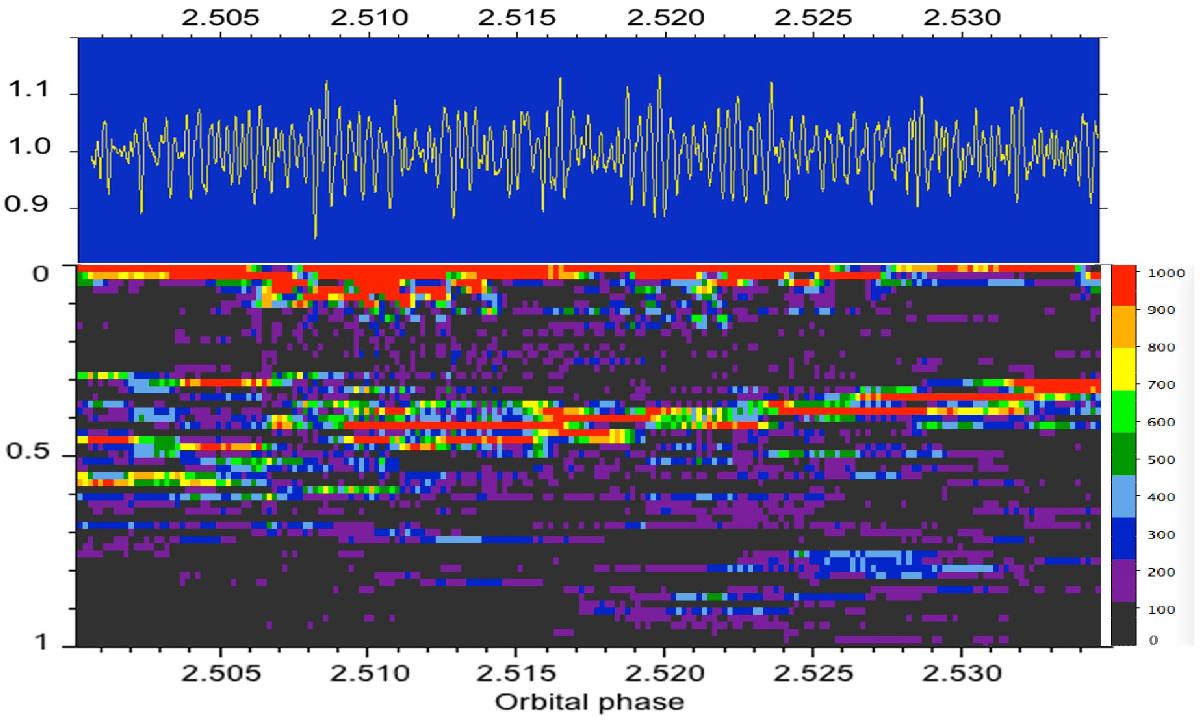
Bottom: two-dimensional time-frequency image of the rms fractional amplitude in a 210 s time interval for the r′ filter (same interval as in Fig. 11). The X-axis is the orbital phase and the Y-axis is the frequency in the restricted range 0−1 Hz, increasing from top to bottom. Colour-coded rms amplitude is shown according to the scale at right (in units of 10-6 rms2 Hz-1). Sliding 52.4 s FFTs have been computed with a 1.28 s step. Top: corresponding fractional r′ light curve shown after normalisation by dividing the original data by a 5 s moving average and after a 0.5 s smoothing to better show the shape of oscillations.
Current usage metrics show cumulative count of Article Views (full-text article views including HTML views, PDF and ePub downloads, according to the available data) and Abstracts Views on Vision4Press platform.
Data correspond to usage on the plateform after 2015. The current usage metrics is available 48-96 hours after online publication and is updated daily on week days.
Initial download of the metrics may take a while.