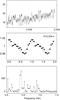
Fig. 11
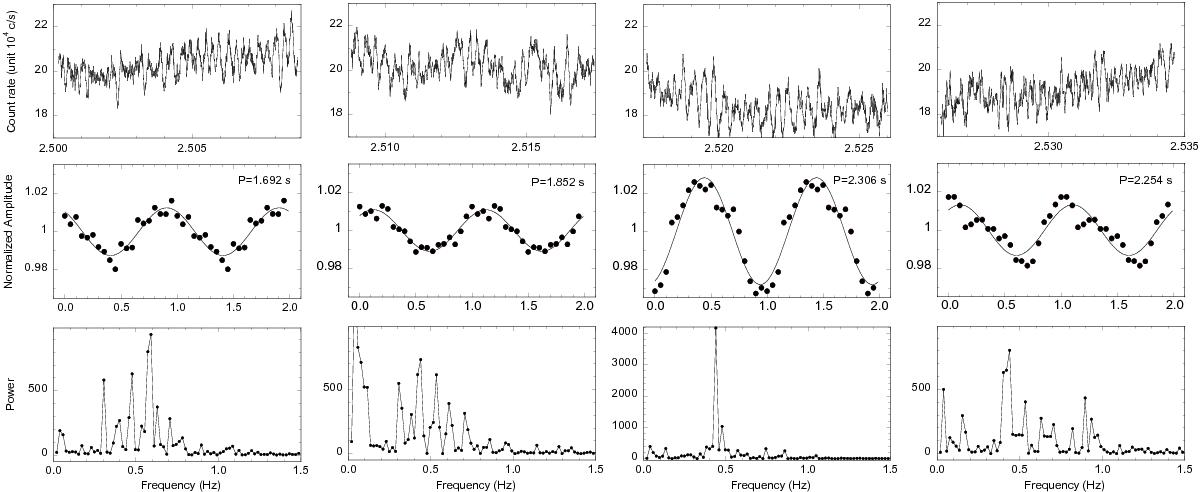
Top: r′ light curve of four contiguous 52.4 s data segments with no overlap (covering the orbital phase interval 2.5 to 2.535 with no interruption). Middle: mean pulse shape. The QPO light curves are folded at the best sinusoidal period indicated and repeated twice for clarity. Bottom: corresponding power spectra using Leahy normalisation. The 90% significance level is at a power value of 17. The Y-scale for power spectra is the same for all segments except the third.
Current usage metrics show cumulative count of Article Views (full-text article views including HTML views, PDF and ePub downloads, according to the available data) and Abstracts Views on Vision4Press platform.
Data correspond to usage on the plateform after 2015. The current usage metrics is available 48-96 hours after online publication and is updated daily on week days.
Initial download of the metrics may take a while.