Fig. 1
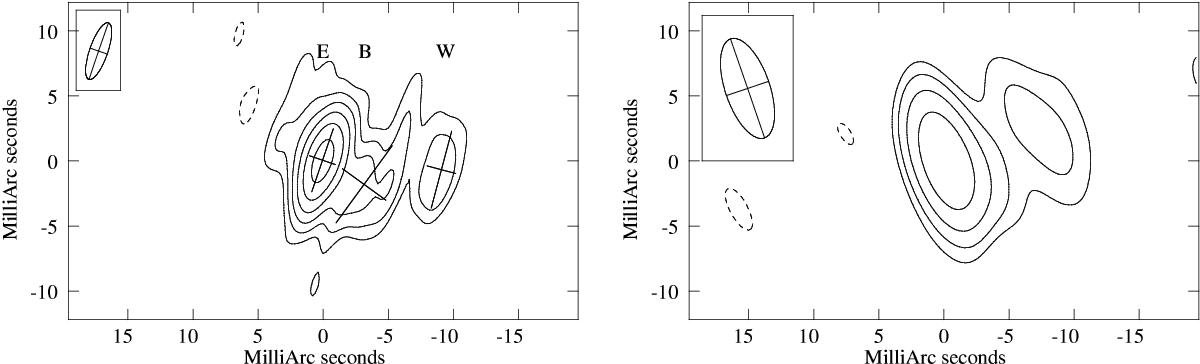
VLBA images of IRAS 17020+4544 on 2014 February 12 at 5 GHz (left panel) and 8.4 GHz (right panel), with contours traced at (− 1,1,2,4,...,32) × the ~ 3σ noise level, which is 0.2 and 0.6 mJy beam-1 at 5 and 8 GHz, respectively. The half peak beam width is shown in the upper left corner of each panel, and is 4.6 mas × 1.4 mas in position angle (PA) − 19° and 8.0 mas × 3.4 mas in PA 19° at 5 and 8 GHz, respectively. Note the unusually larger beam at 8 GHz, due to the lack of fringe detections on the longest baselines at this frequency. In the 5 GHz image, model-fit elliptical Gaussian components are shown as crosses and labelled E, B, W, from east to west.
Current usage metrics show cumulative count of Article Views (full-text article views including HTML views, PDF and ePub downloads, according to the available data) and Abstracts Views on Vision4Press platform.
Data correspond to usage on the plateform after 2015. The current usage metrics is available 48-96 hours after online publication and is updated daily on week days.
Initial download of the metrics may take a while.