Fig. 3
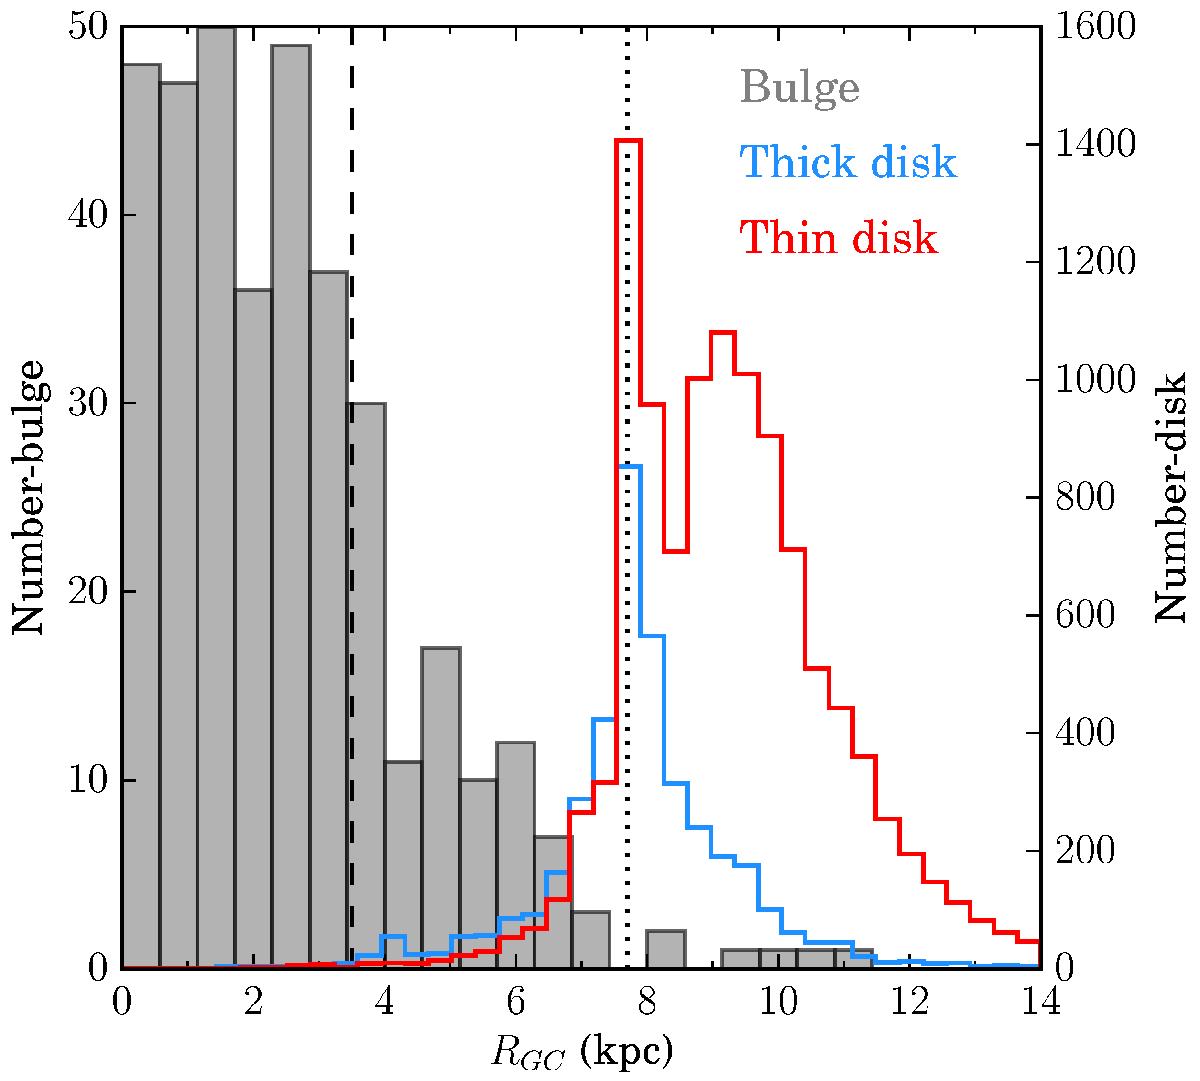
Distribution of the Galactocentric distances of our APOGEE sample. Grey bars indicate bulge stars (according to the left vertical scale), while the blue and red open histograms show the thick and the thin disc (according to the right vertical scale), respectively. The vertical dashed line defines our cut at RGC = 3.5 kpc to select likely bulge stars, while the vertical dotted line represents our cut at RGC = 7.7 kpc used to select the comparison disc sample (see Sect. 6).
Current usage metrics show cumulative count of Article Views (full-text article views including HTML views, PDF and ePub downloads, according to the available data) and Abstracts Views on Vision4Press platform.
Data correspond to usage on the plateform after 2015. The current usage metrics is available 48-96 hours after online publication and is updated daily on week days.
Initial download of the metrics may take a while.