Free Access
Fig. 6
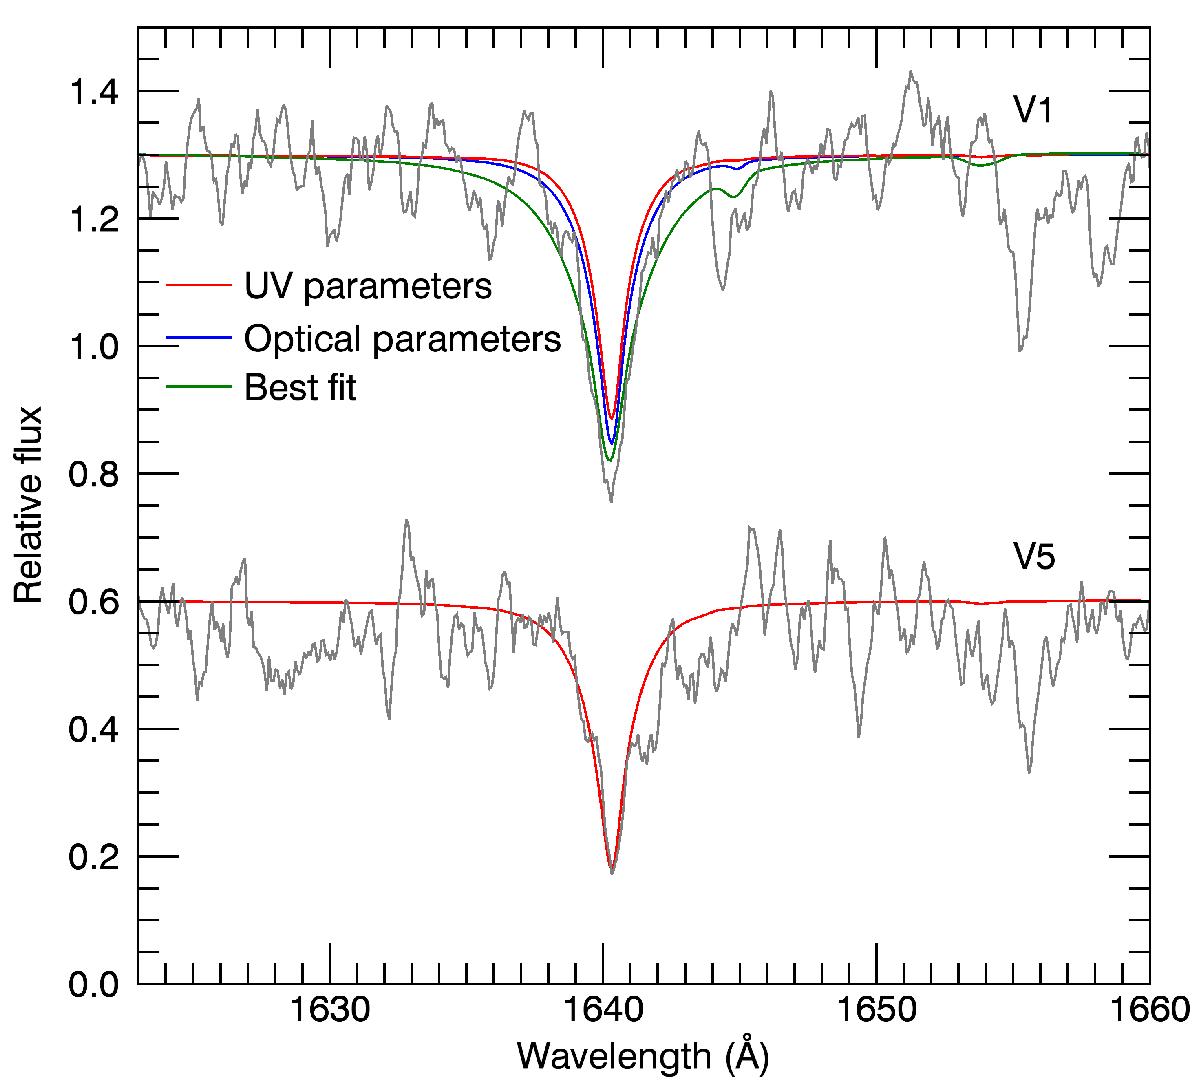
Comparison between the observed He ii λ1640 line (grey) for V1 and V5 and synthetic spectra at their UV optimal temperature (red). For V1 we added also a model at the optical determined temperature (blue) and the best fit model to the line (green).
Current usage metrics show cumulative count of Article Views (full-text article views including HTML views, PDF and ePub downloads, according to the available data) and Abstracts Views on Vision4Press platform.
Data correspond to usage on the plateform after 2015. The current usage metrics is available 48-96 hours after online publication and is updated daily on week days.
Initial download of the metrics may take a while.