Fig. 5
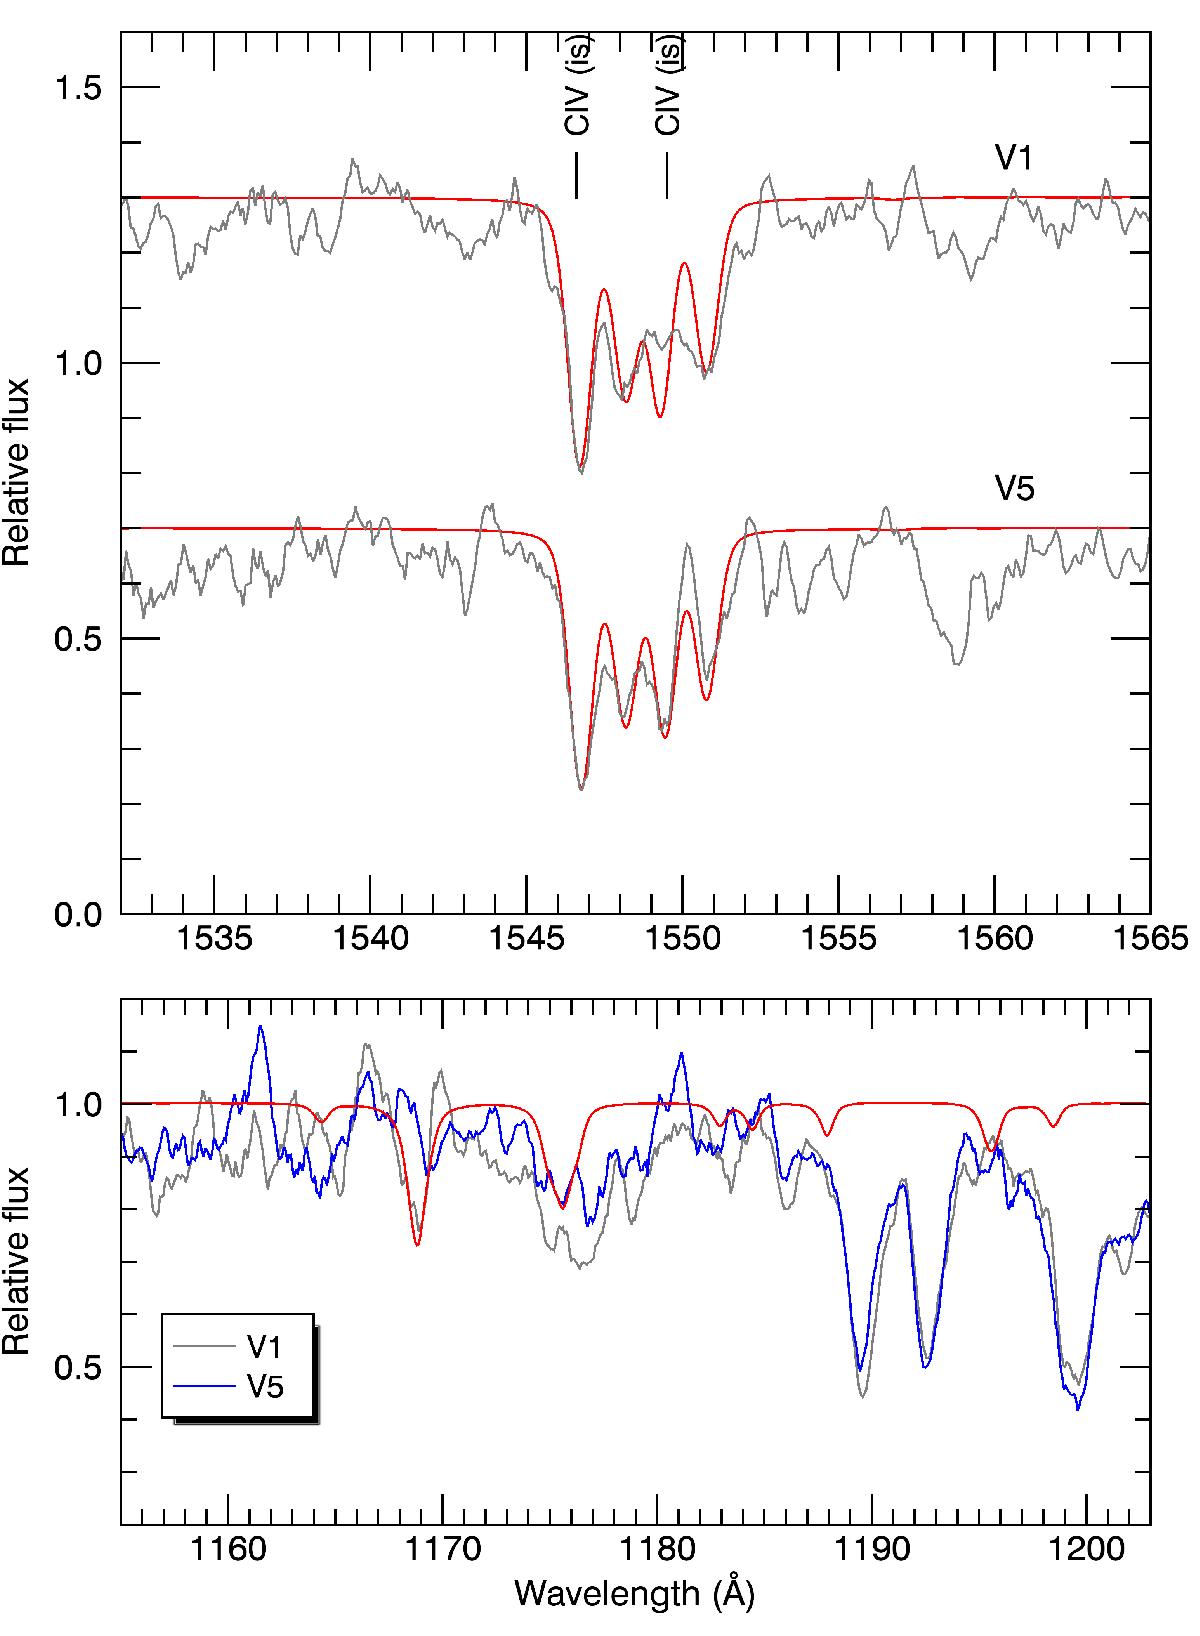
Upper panel: comparison between the observed (grey) spectra of V1 and V5 in the C iv doublet region and synthetic spectra combining interstellar and photospheric lines (red). The normalized spectra are shifted along the y axis for better visualization. Lower panel: the region of the C iv (1169 Å) and C iii (≈1176 Å) lines is shown for V1 and V5. A theoretical spectrum is shown in red as comparison.
Current usage metrics show cumulative count of Article Views (full-text article views including HTML views, PDF and ePub downloads, according to the available data) and Abstracts Views on Vision4Press platform.
Data correspond to usage on the plateform after 2015. The current usage metrics is available 48-96 hours after online publication and is updated daily on week days.
Initial download of the metrics may take a while.