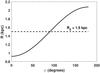
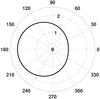
Fig. 3
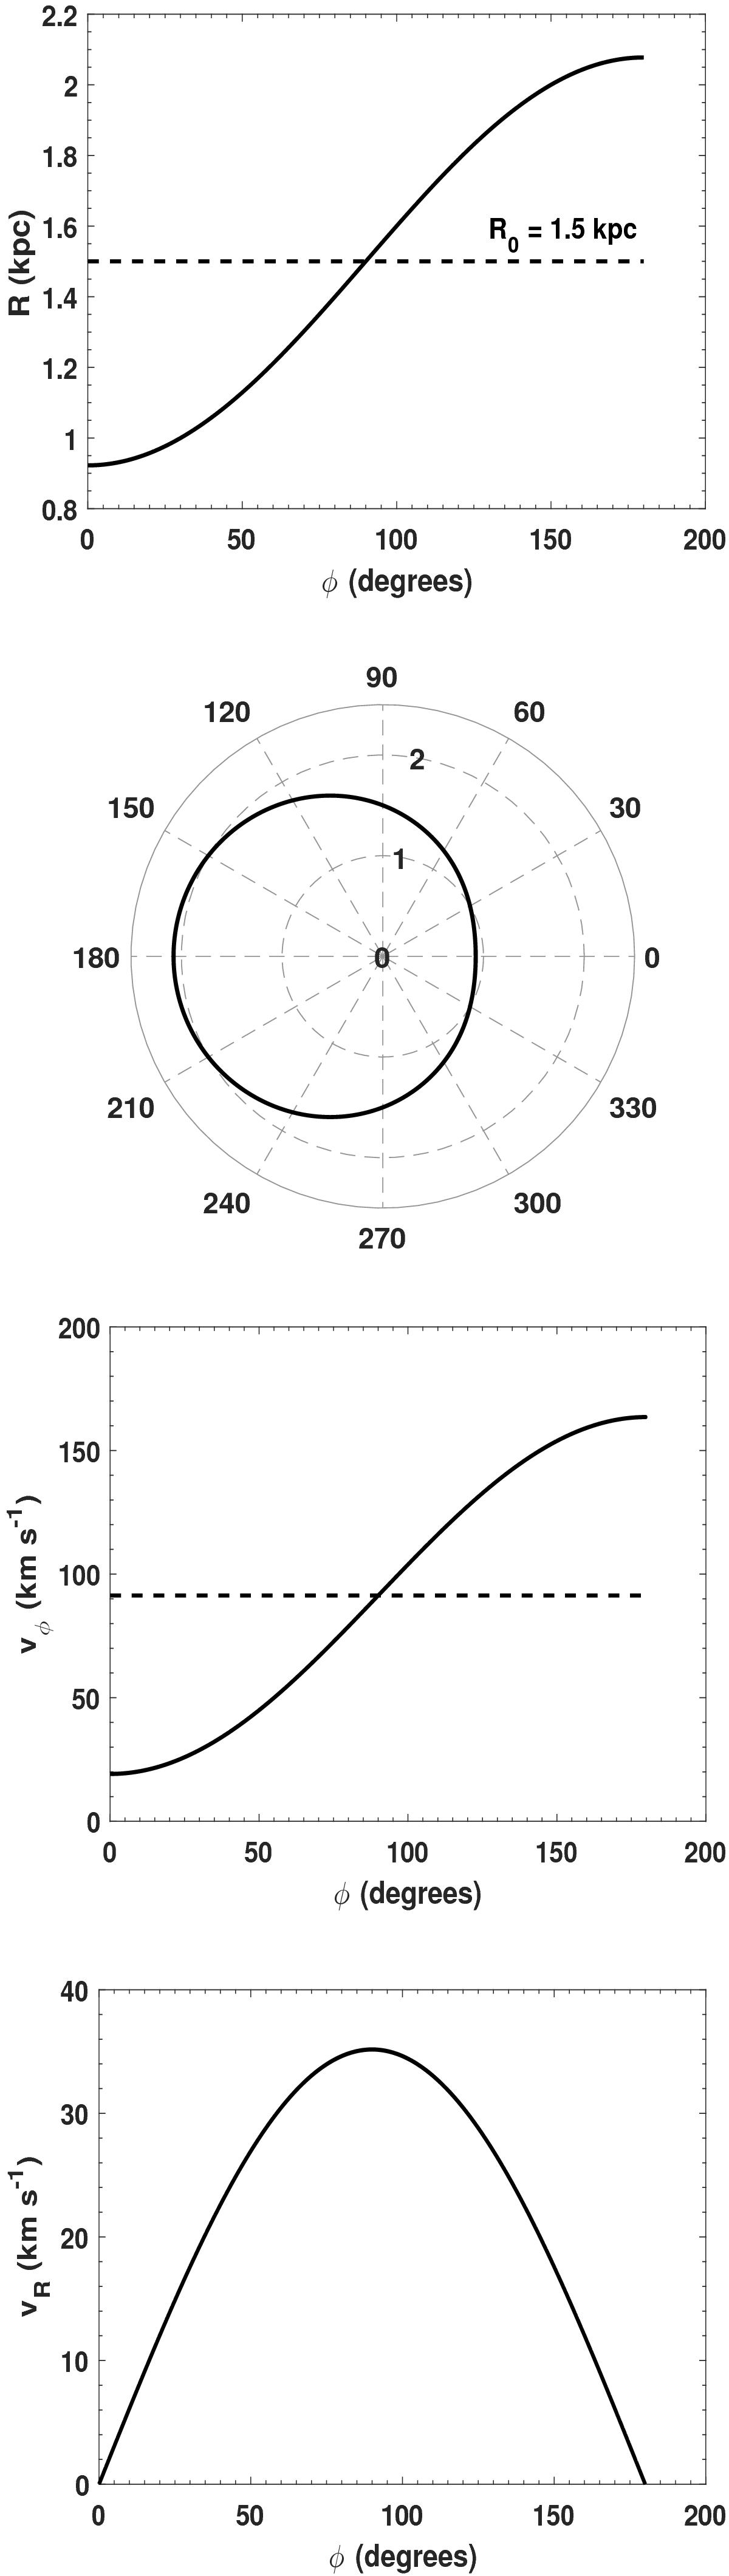
Resulting orbit for an initial circular orbit at R = 1.5 kpc, shown as R vs. φ in panel a), and as a polar plot in panel b). The net azimuthal and radial velocity components vs. φ are shown in panels c) and d), respectively. The dashed line in panel c) denotes vc. Panels a) and b) show that the orbit is strongly distorted or lopsided spatially: it is shortened along φ = 0° and elongated in the opposite direction, i.e., along φ = 180°.
Current usage metrics show cumulative count of Article Views (full-text article views including HTML views, PDF and ePub downloads, according to the available data) and Abstracts Views on Vision4Press platform.
Data correspond to usage on the plateform after 2015. The current usage metrics is available 48-96 hours after online publication and is updated daily on week days.
Initial download of the metrics may take a while.