Fig. 5
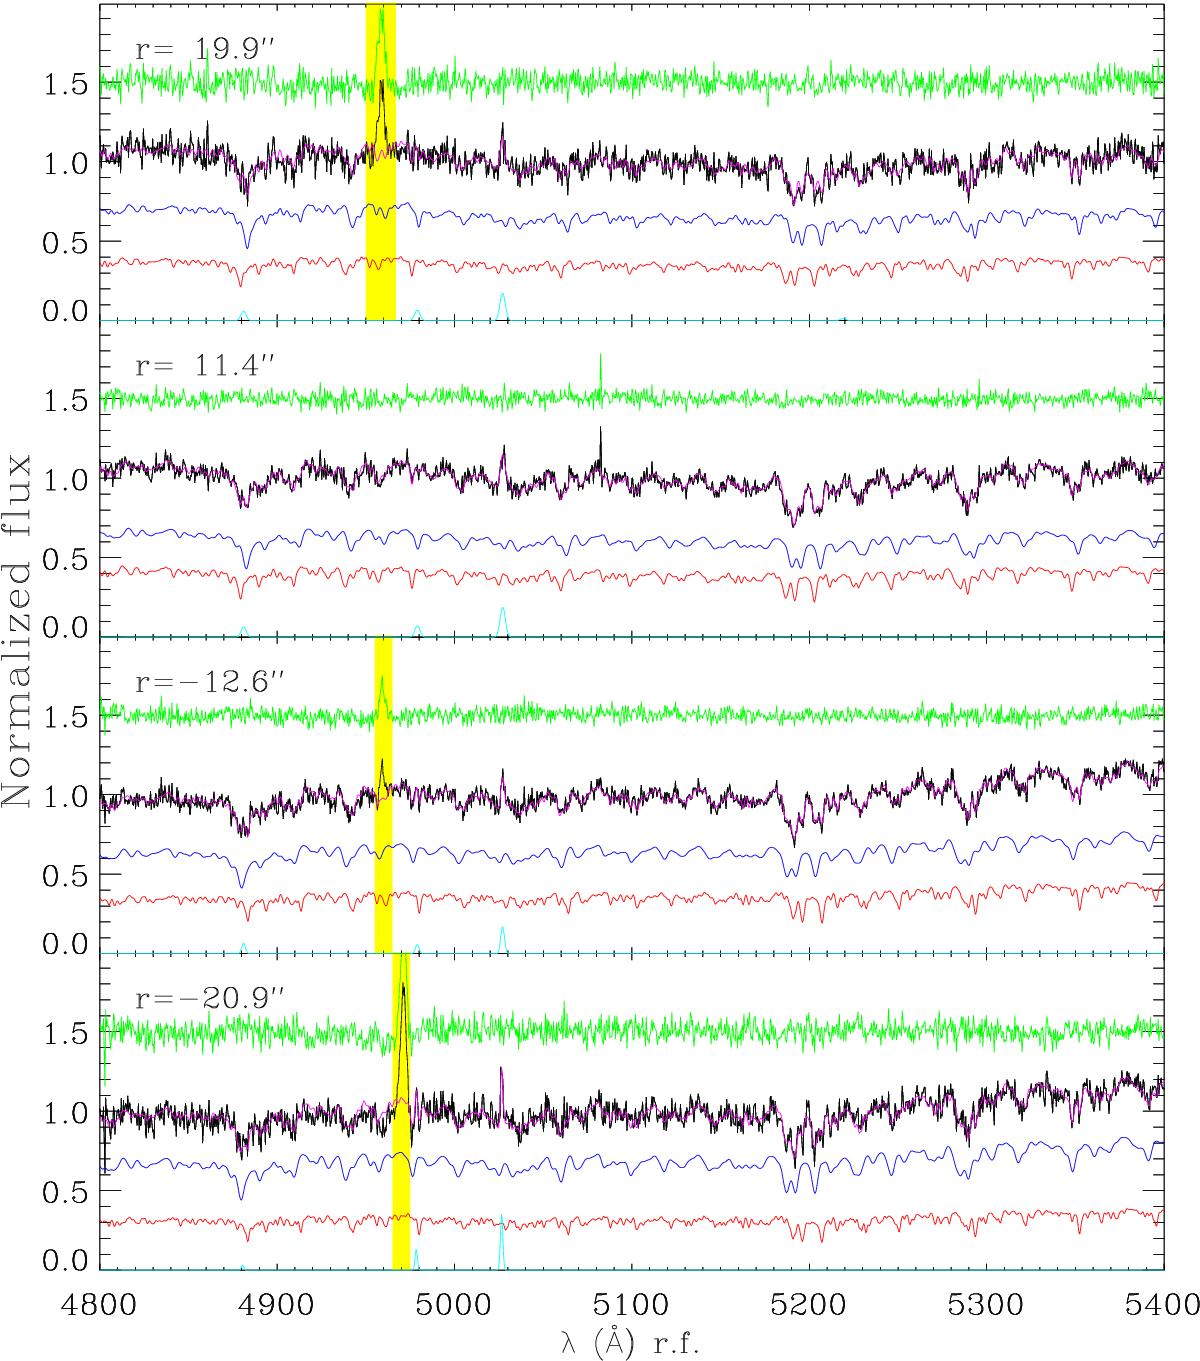
Decomposition of the major-axis spectrum of NGC 1366 (black line) in the analyzed spatial bins (r = −20.9″,−12.6″,11.4″ and 19.9″). The best-fitting model (magenta line) is the sum of the spectra of the corotating (red line) and counter-rotating stellar component (blue line) and of the ionized-gas component (cyan line). The normalized flux of the fit residual (green line) has a false zero-point for viewing convenience. The yellow shaded area indicates a spectral region masked in the fit that is due to the imperfect subtraction of the spurious signal, which is the result of a reflection on the EMMI CCD.
Current usage metrics show cumulative count of Article Views (full-text article views including HTML views, PDF and ePub downloads, according to the available data) and Abstracts Views on Vision4Press platform.
Data correspond to usage on the plateform after 2015. The current usage metrics is available 48-96 hours after online publication and is updated daily on week days.
Initial download of the metrics may take a while.