Free Access
Fig. 11

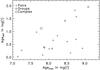
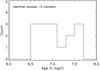
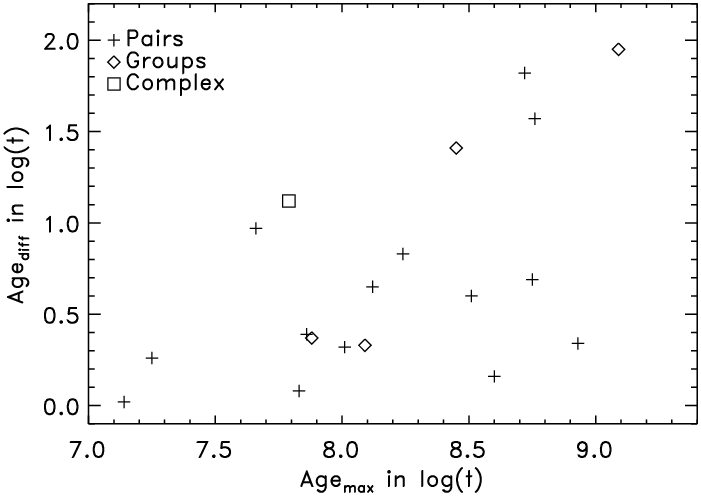
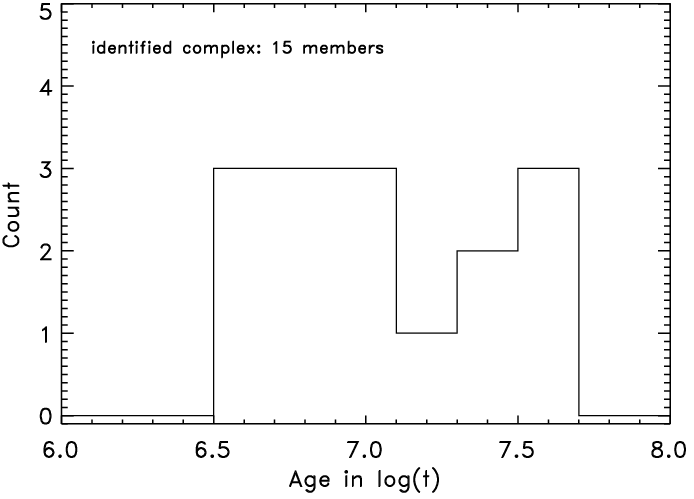
Upper panel: relation between maximum age difference for the detected OC groupings and the age of its oldest member (with linking lengths 100 pc and 10 km s-1). Lower panel: histogram for the age distribution in the detected OC complex.
This figure is made of several images, please see below:
Current usage metrics show cumulative count of Article Views (full-text article views including HTML views, PDF and ePub downloads, according to the available data) and Abstracts Views on Vision4Press platform.
Data correspond to usage on the plateform after 2015. The current usage metrics is available 48-96 hours after online publication and is updated daily on week days.
Initial download of the metrics may take a while.