Fig. 3
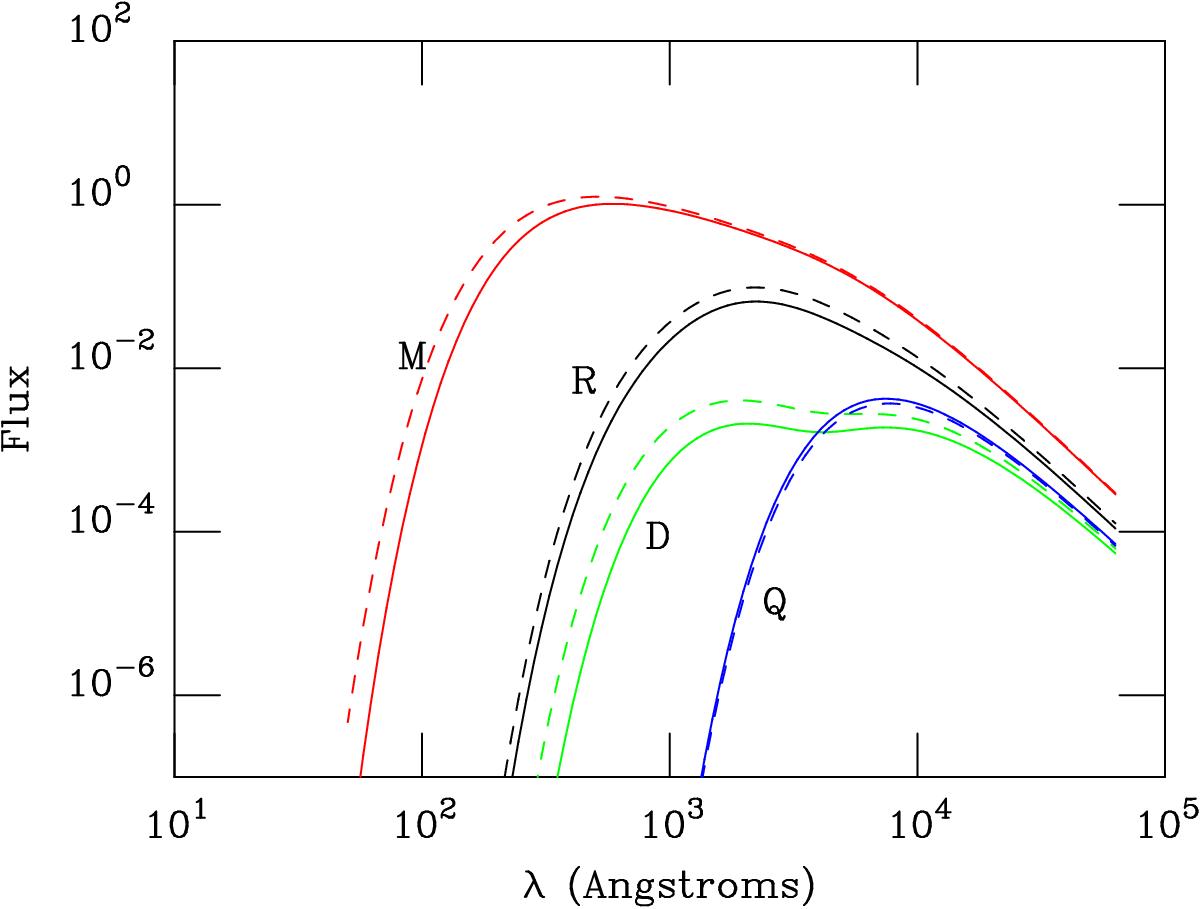
Energy spectra emitted by the accretion disc at times indicated in Fig. 2. The black curve corresponds to the rise to maximum (R), the red curve to the outburst maximum (M), the green curve to decay (D), and the blue curve to quiescence (Q). The solid line corresponds to the unilluminated case; the dashed line to the maximally irradiated case. Contributions from other components, i.e. white dwarf surface, boundary layer, hot spot, and secondary star, have not been included here.
Current usage metrics show cumulative count of Article Views (full-text article views including HTML views, PDF and ePub downloads, according to the available data) and Abstracts Views on Vision4Press platform.
Data correspond to usage on the plateform after 2015. The current usage metrics is available 48-96 hours after online publication and is updated daily on week days.
Initial download of the metrics may take a while.