Fig. 9
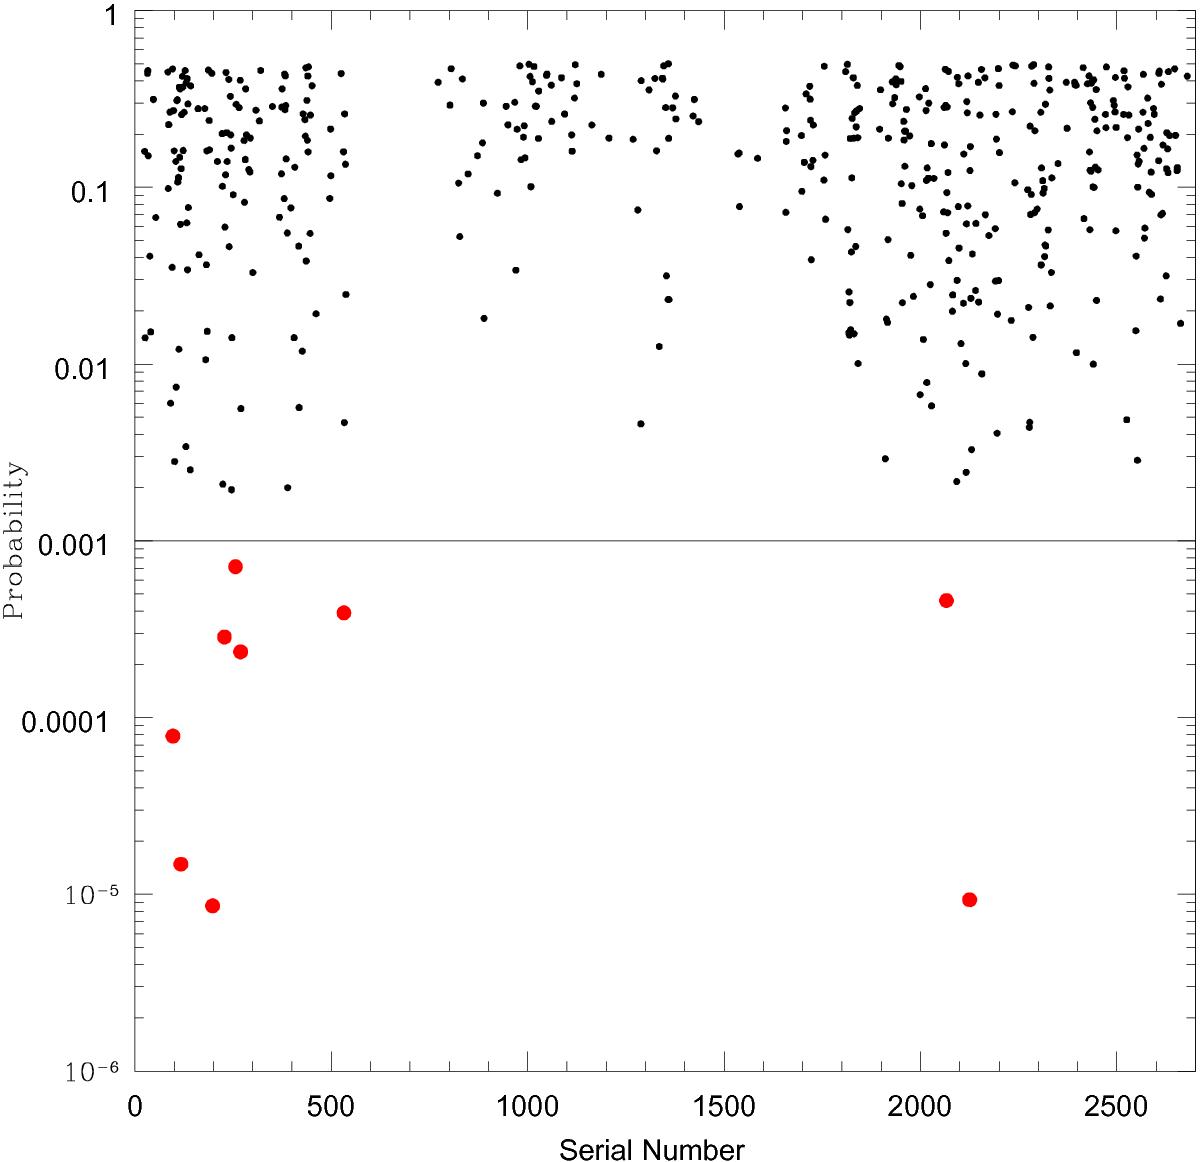
Probability of finding Γ−log FS correlation by chance. The most significantly correlated sources are chosen by having probability lower than 10-3 (horizontal line). The nine selected sources are shown as red circles. One of these sources (198, also known as PG 1114+445) was discarded due to the well-known presence of a warm absorber, reducing the number of analysed sources to eight.
Current usage metrics show cumulative count of Article Views (full-text article views including HTML views, PDF and ePub downloads, according to the available data) and Abstracts Views on Vision4Press platform.
Data correspond to usage on the plateform after 2015. The current usage metrics is available 48-96 hours after online publication and is updated daily on week days.
Initial download of the metrics may take a while.