Fig. 5
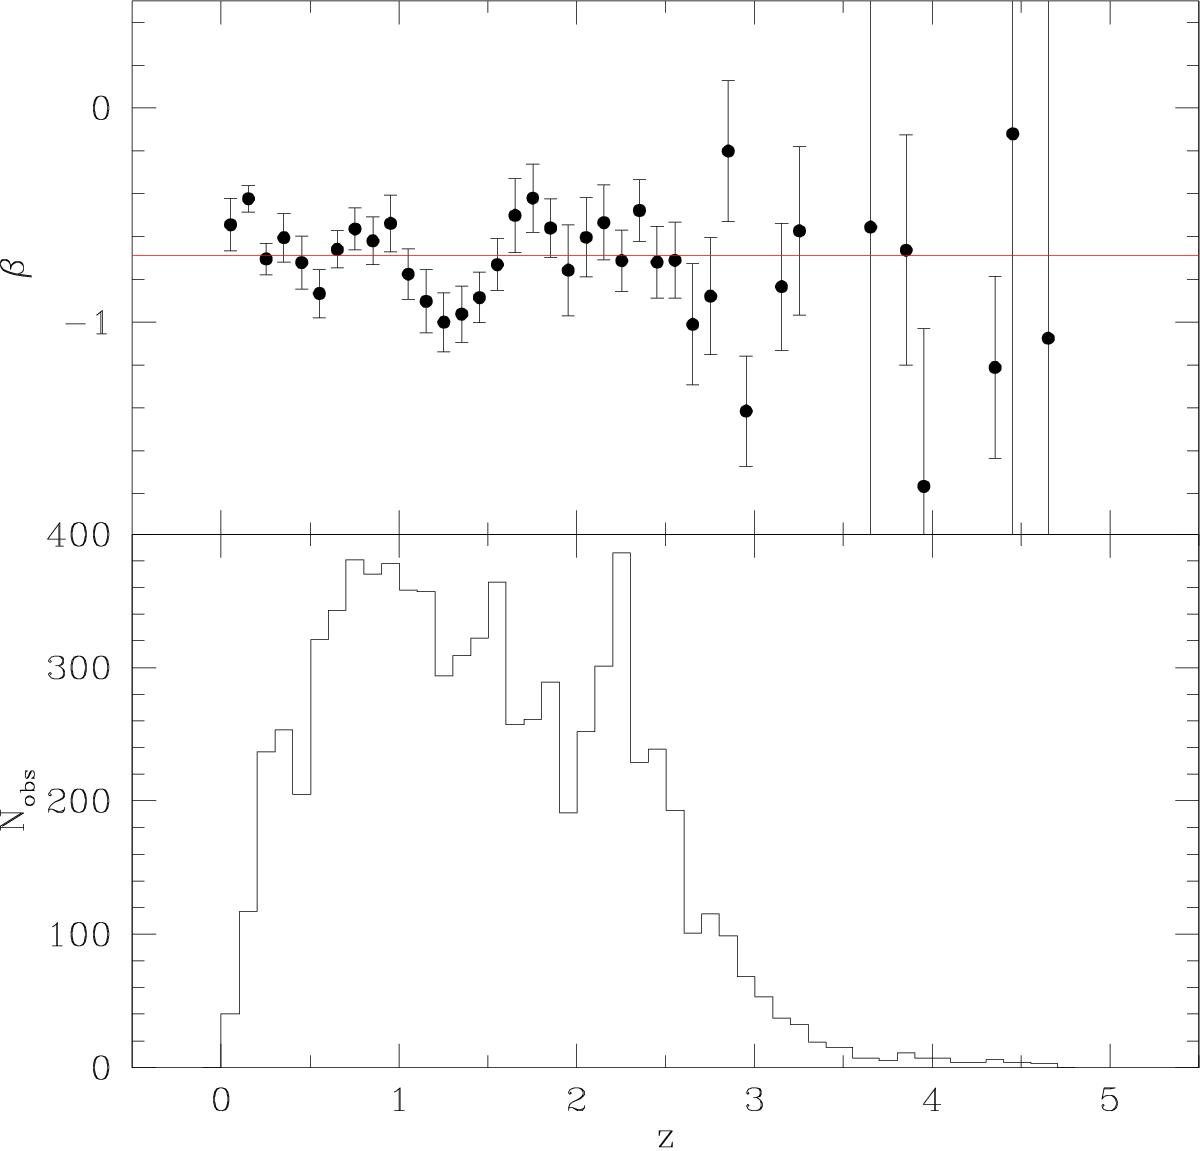
Top: dependence of β on the redshift. The red line represents the ensemble value β = −0.69. The value of β doesn’t show a clear trend with redshift, although some deviations are present for some bins. Bottom: redshift histogram of the sample. Up to z ≃ 2.8, the number of points in each bin is ≳ 102, while for z ≳ 2.8 the bins include much fewer points, and therefore the βs have greater errors.
Current usage metrics show cumulative count of Article Views (full-text article views including HTML views, PDF and ePub downloads, according to the available data) and Abstracts Views on Vision4Press platform.
Data correspond to usage on the plateform after 2015. The current usage metrics is available 48-96 hours after online publication and is updated daily on week days.
Initial download of the metrics may take a while.