Fig. 3
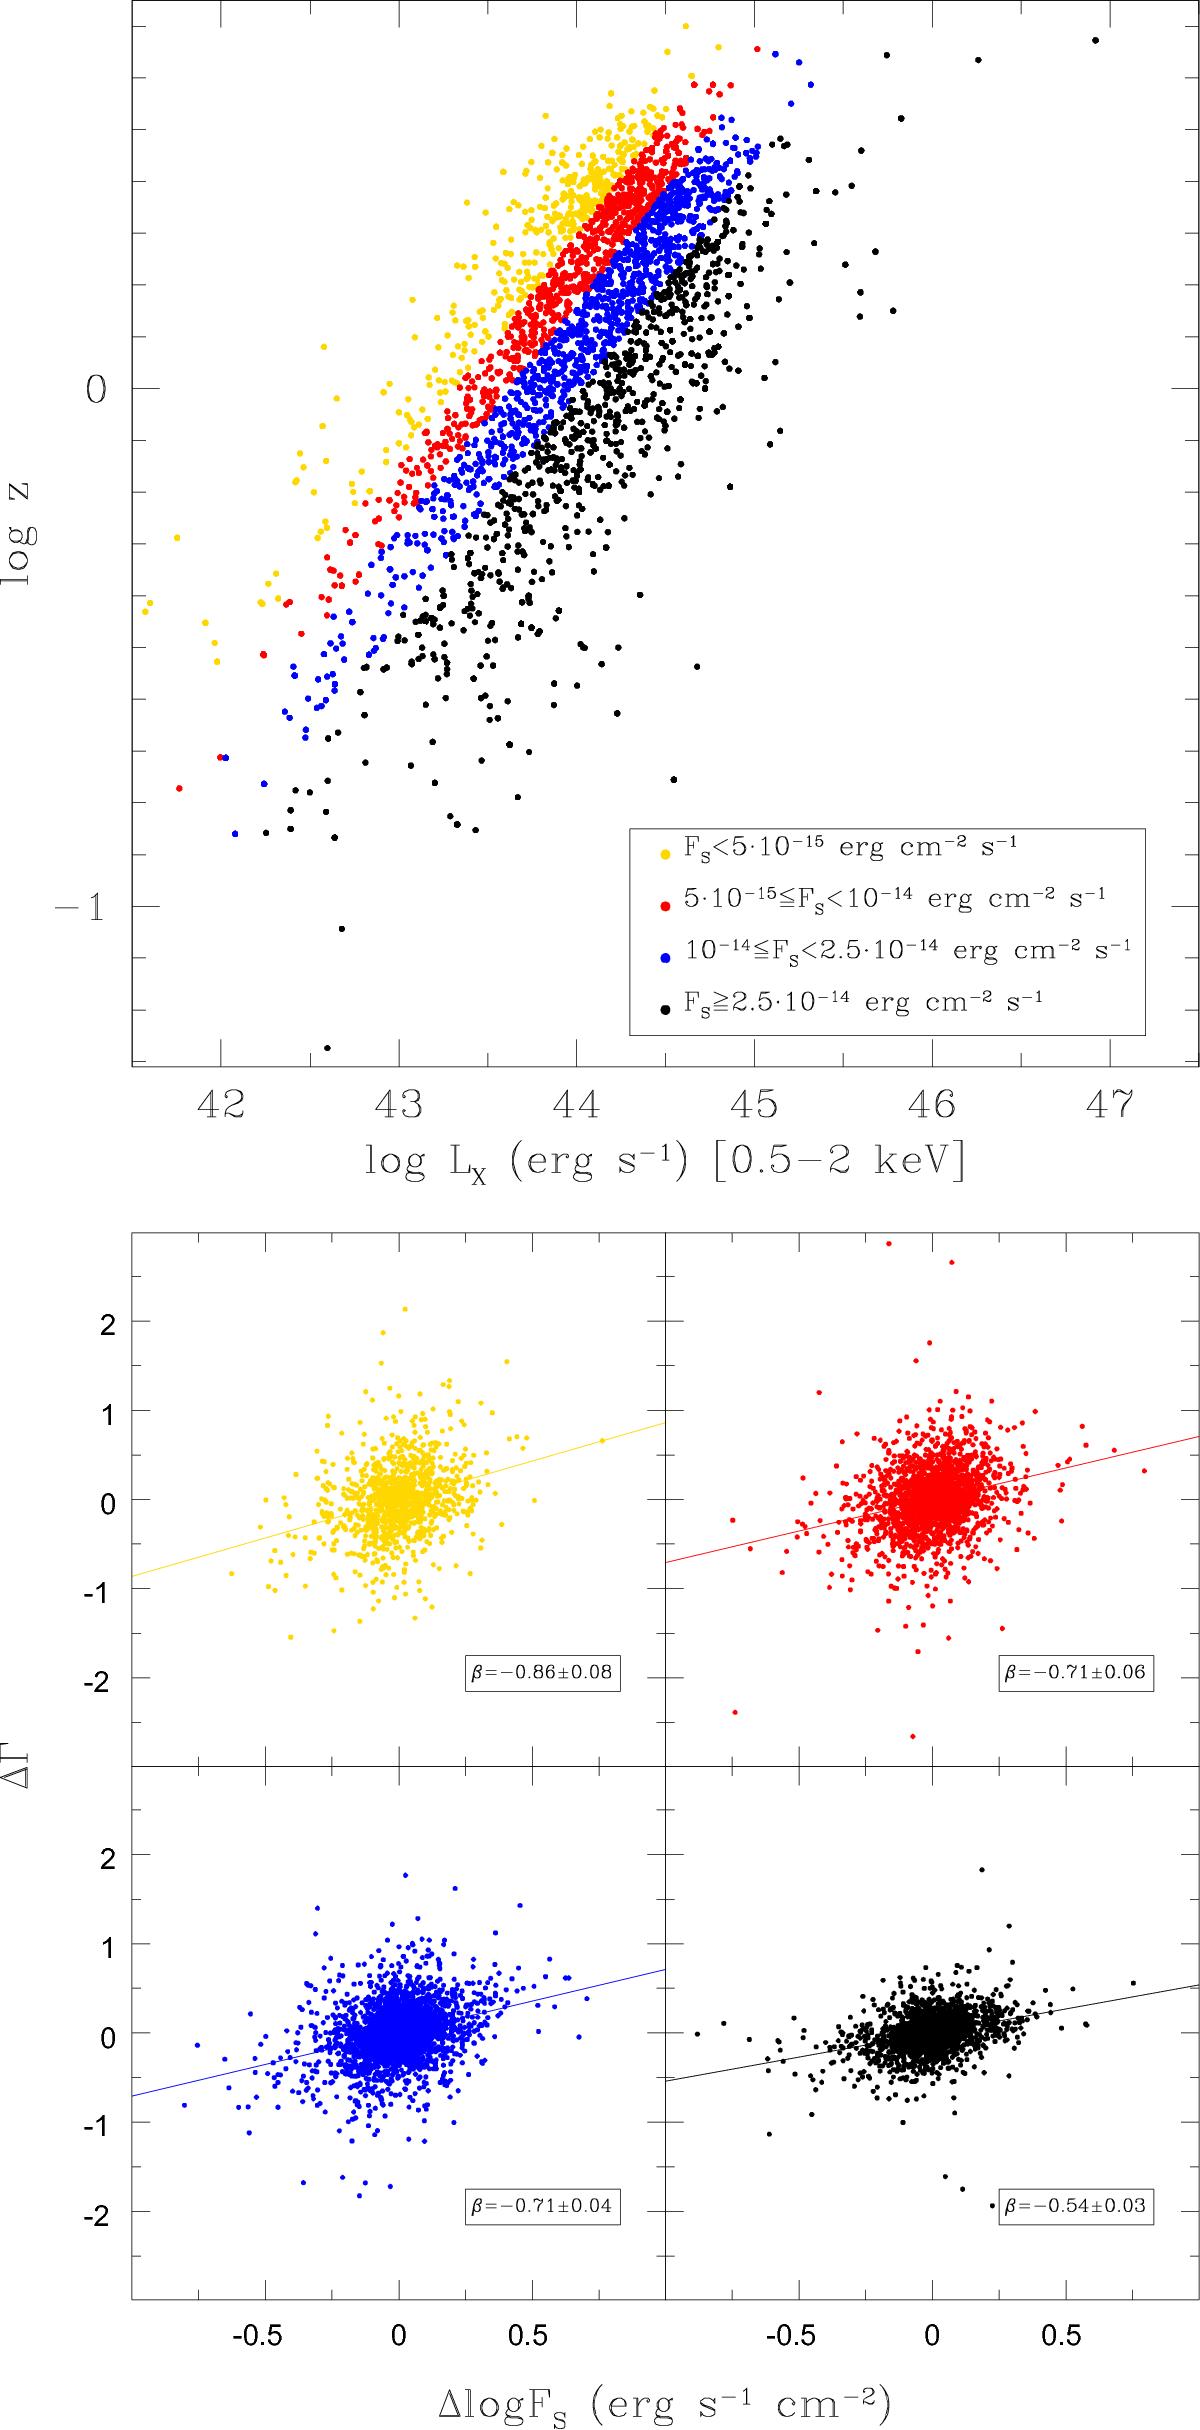
Top: distribution of the sources in the z−LX plane. Positions of four different flux bins in the z−LX plane are clearly distinguishable as parallel stripes. Different colours represent different average flux bins. Bottom: ΔΓ−Δlog FS plots for the same four flux bins, drawing the linear fit lines for each bin. The slope, which is the opposite of β, decreases for increasing fluxes. The correlation coefficients are approximately 0.3 and are reported in Table 2. All probabilities of obtaining such correlations by chance are p( >r) < 10-10.
Current usage metrics show cumulative count of Article Views (full-text article views including HTML views, PDF and ePub downloads, according to the available data) and Abstracts Views on Vision4Press platform.
Data correspond to usage on the plateform after 2015. The current usage metrics is available 48-96 hours after online publication and is updated daily on week days.
Initial download of the metrics may take a while.