Fig. 2
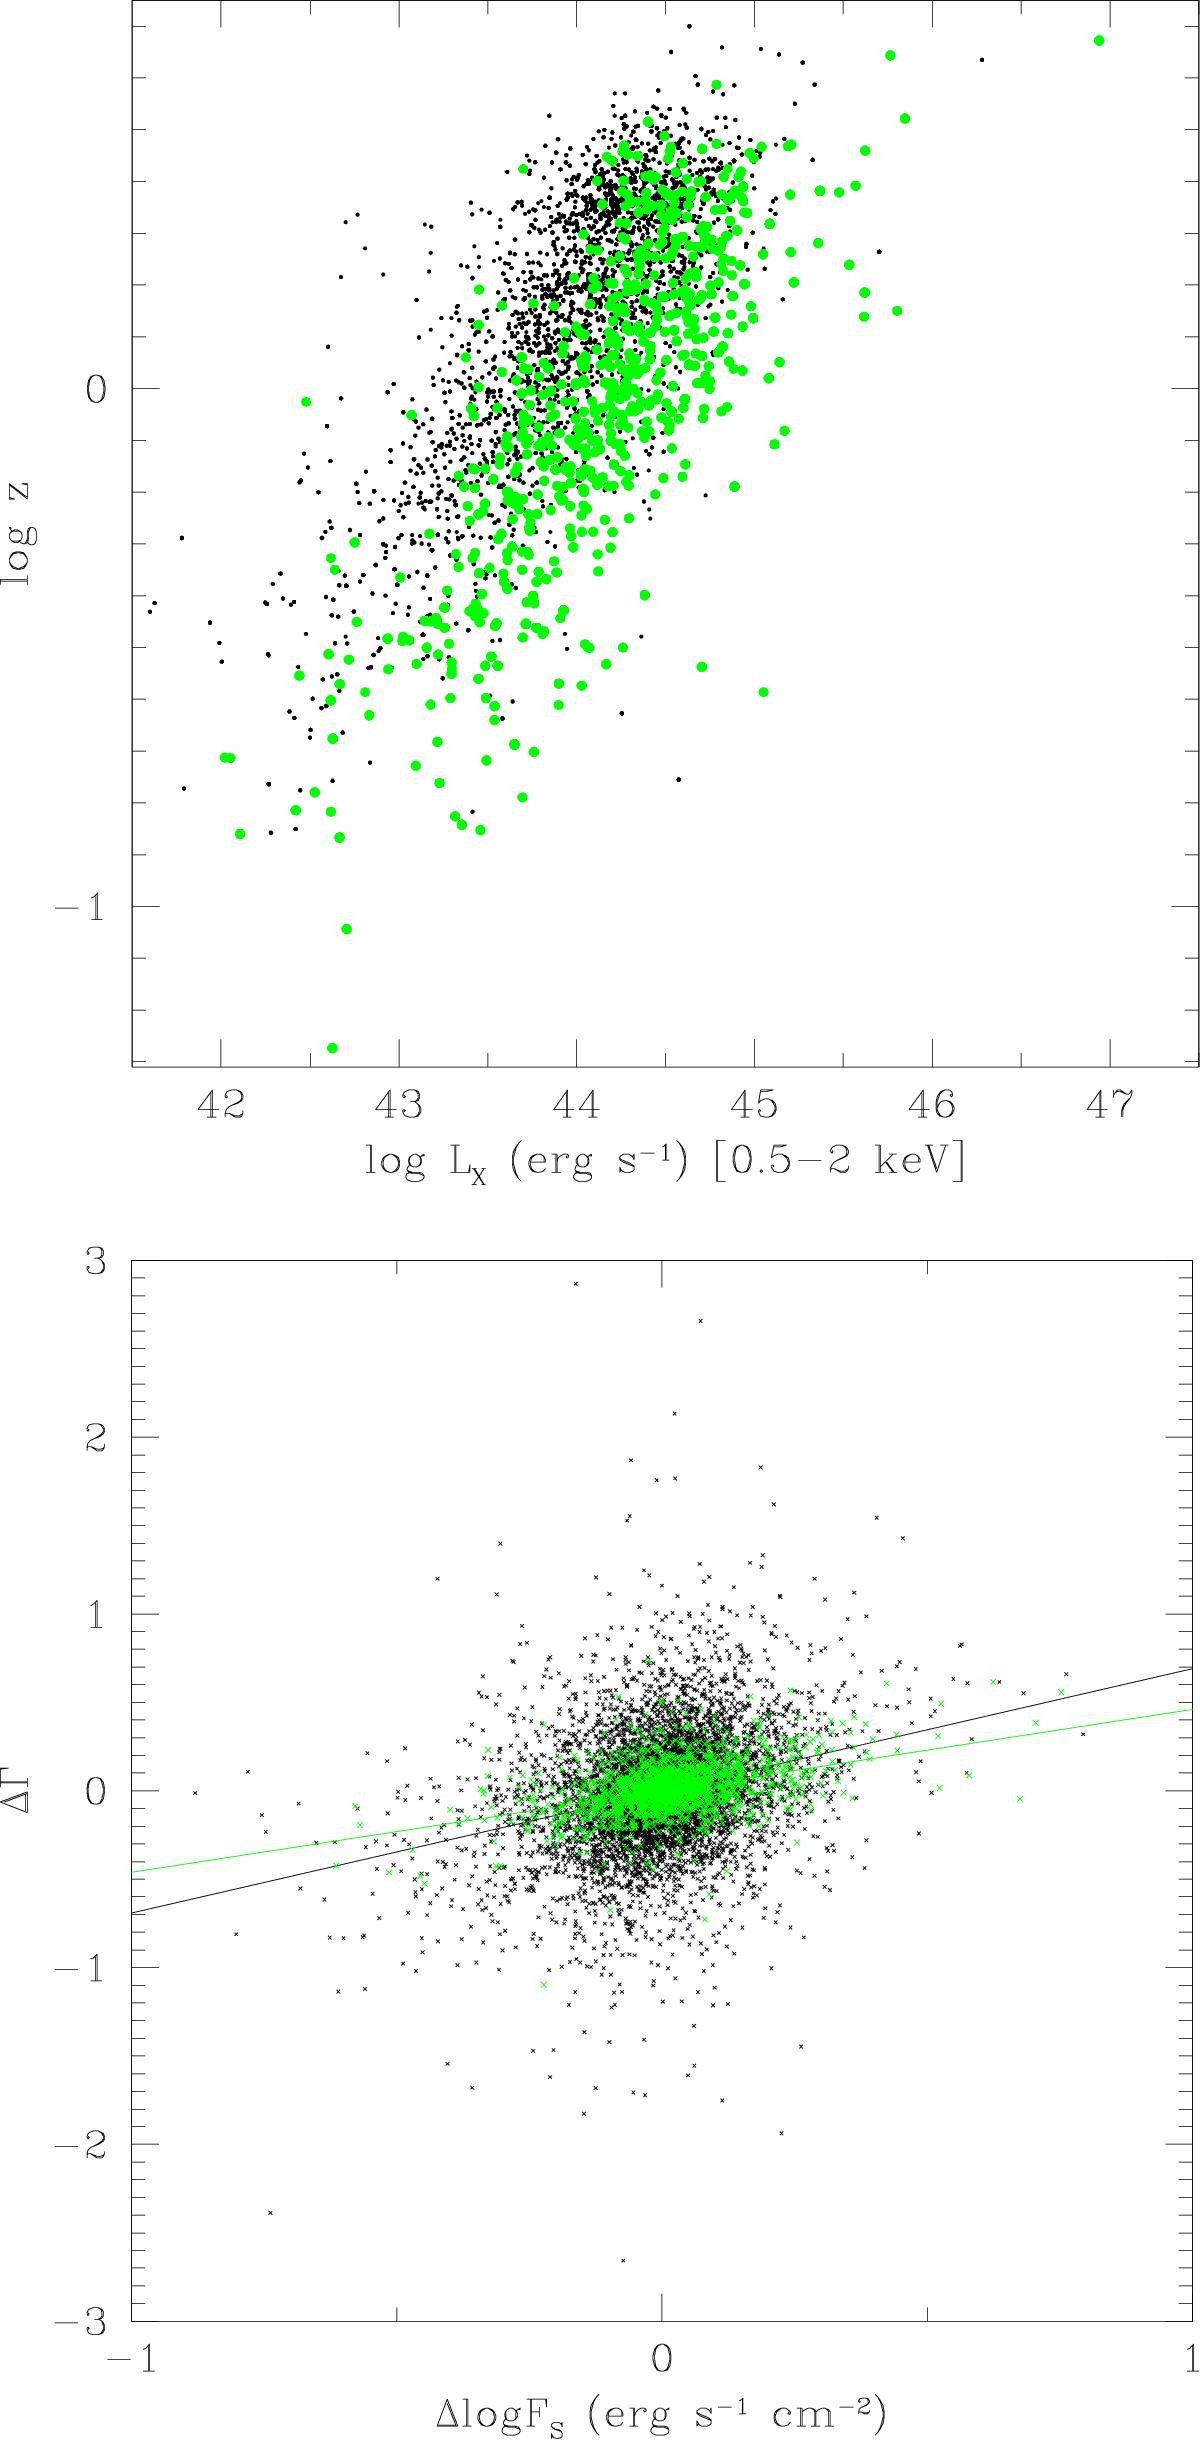
Top: relation between the X-ray luminosity LX and the redshift z. Sources in green are the ones that are present in both the XMMFITCAT and MEXSAS catalogue, while the black dots are sources only present in the latter. The green circles are selected by Corral et al. (2015), when the number of counts is at least 50, and these sources are, on average, brighter than the ones not included. Bottom: ΔΓ−Δlog FS correlation, plotted using the photon indices from our analysis, for the same two subsets. The green line shows the linear fit of just the green data, while the black line is the linear fit of the whole sample.
Current usage metrics show cumulative count of Article Views (full-text article views including HTML views, PDF and ePub downloads, according to the available data) and Abstracts Views on Vision4Press platform.
Data correspond to usage on the plateform after 2015. The current usage metrics is available 48-96 hours after online publication and is updated daily on week days.
Initial download of the metrics may take a while.