Fig. 5
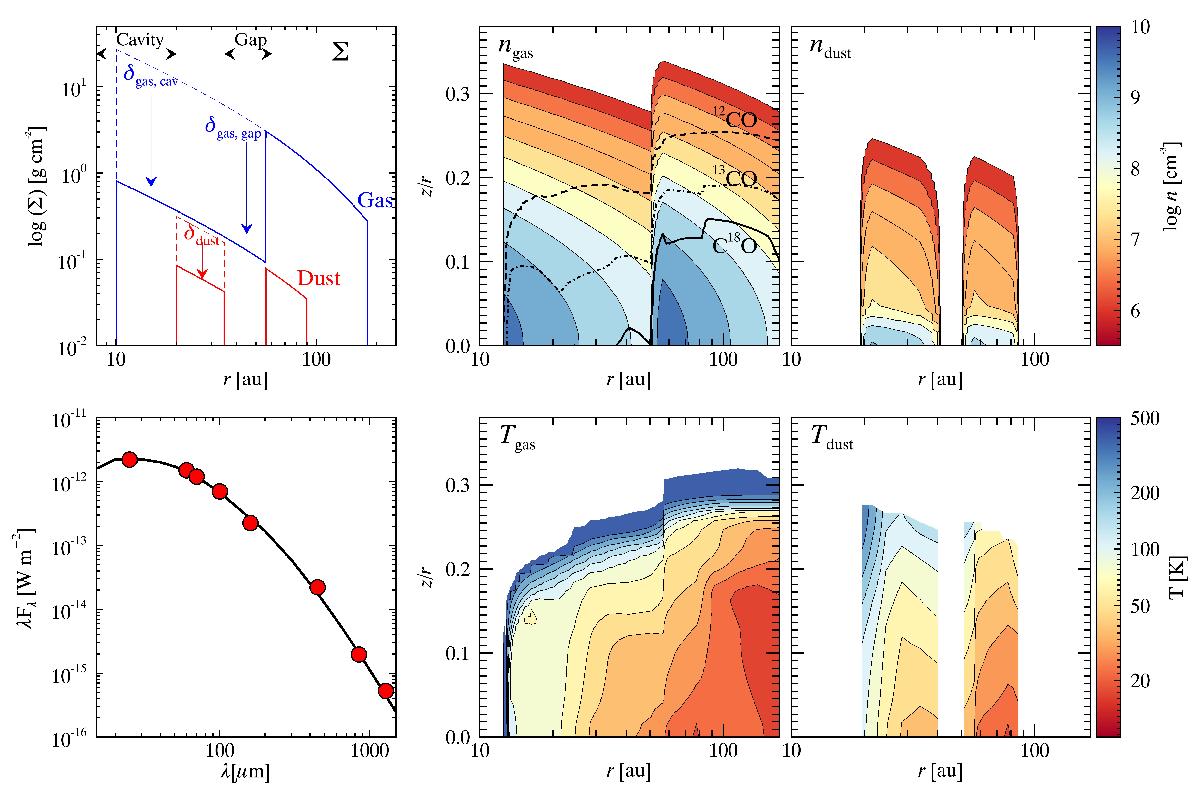
Fiducial model: (top left) surface density profile; (top middle) gas density structure: the τ = 1 layer of the J = 2−1 transition is overlaid as the dashed (12CO), dot-dashed (13CO), and solid (C18O) curve; (top right) dust density structure; (bottom left) spectral energy distribution with fiducial model (black solid curve): data (red dots) are from IRAS, Herschel (Pascual et al. 2016), SCUBA (Sandell et al. 2011), and ALMA (this work); (bottom middle) gas temperature structure; (bottom right) dust temperature structure.
Current usage metrics show cumulative count of Article Views (full-text article views including HTML views, PDF and ePub downloads, according to the available data) and Abstracts Views on Vision4Press platform.
Data correspond to usage on the plateform after 2015. The current usage metrics is available 48-96 hours after online publication and is updated daily on week days.
Initial download of the metrics may take a while.