Fig. 3
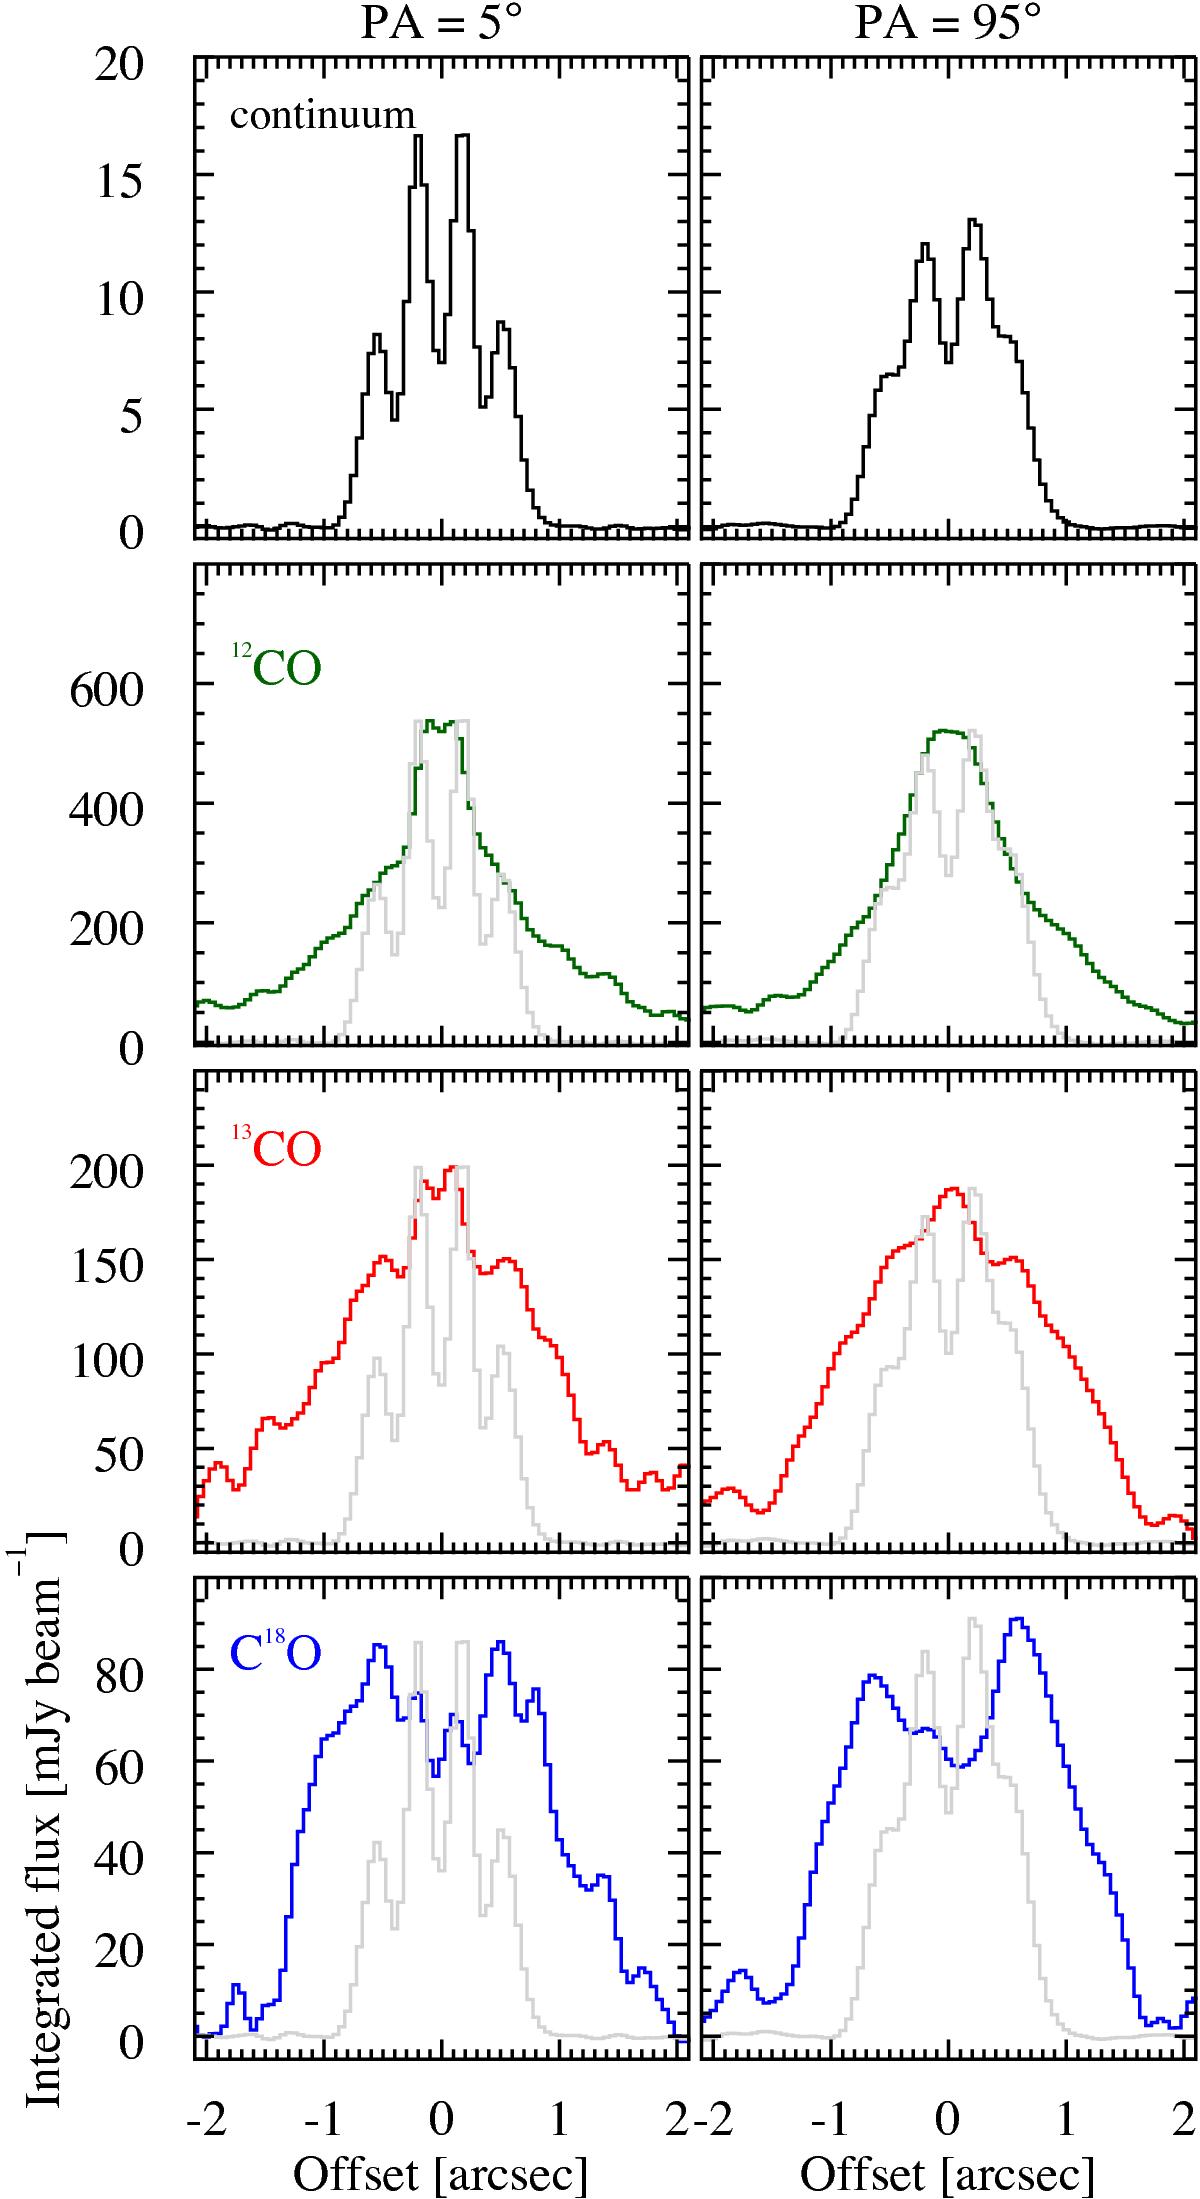
Intensity profiles of the dust continuum and CO isotopolog integrated emission maps along the major (PA = 5°, left) and minor (PA = 95°, right) disk axis. The normalized continuum profile is overlaid (gray) on the CO panels for comparison. Note that the large-scale (>2″) emission of 12CO and 13CO is the result of the reduced image quality (see Sect. 2).
Current usage metrics show cumulative count of Article Views (full-text article views including HTML views, PDF and ePub downloads, according to the available data) and Abstracts Views on Vision4Press platform.
Data correspond to usage on the plateform after 2015. The current usage metrics is available 48-96 hours after online publication and is updated daily on week days.
Initial download of the metrics may take a while.