Fig. 1
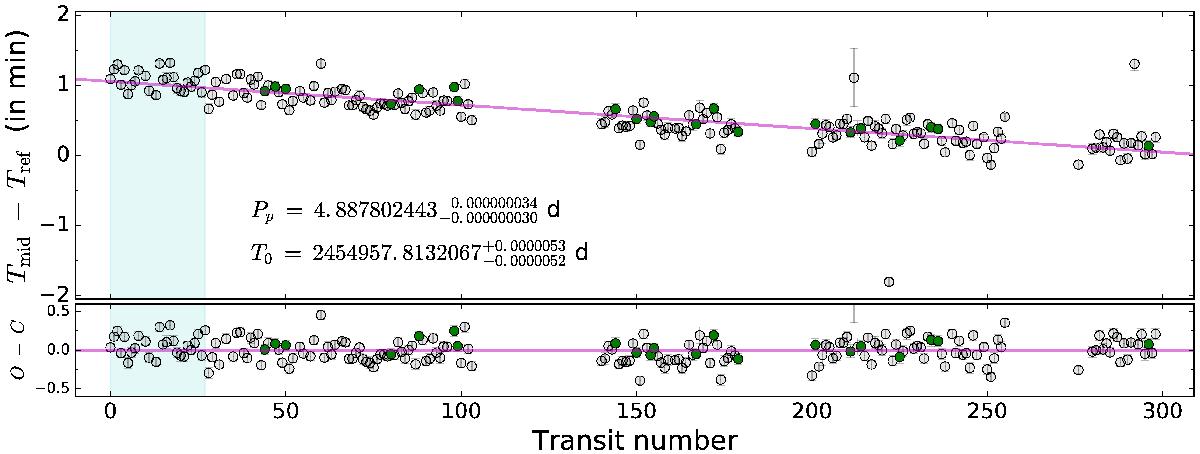
Measurements of mid-transit times from 206Kepler transits. The (magenta) line represents a first-order polynomial fit to the error-weighted measurements. The lower panel shows the residuals with outliers removed. See caption and text of original paper for more detailed explanations.
Current usage metrics show cumulative count of Article Views (full-text article views including HTML views, PDF and ePub downloads, according to the available data) and Abstracts Views on Vision4Press platform.
Data correspond to usage on the plateform after 2015. The current usage metrics is available 48-96 hours after online publication and is updated daily on week days.
Initial download of the metrics may take a while.