Fig. 8
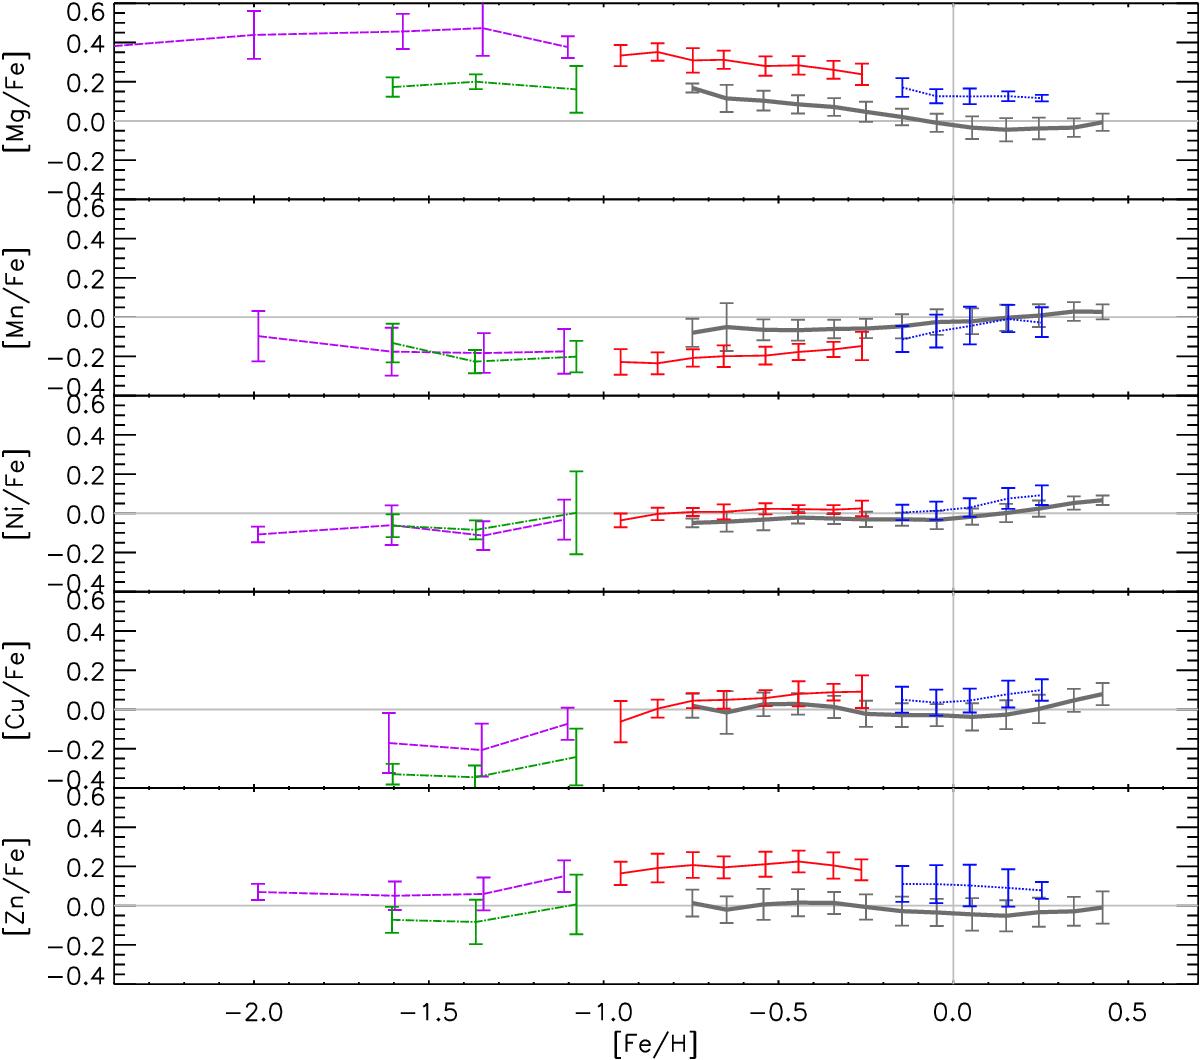
Same plot as Fig. 6, but data are averaged in [Fe/H] bins. Thin disc (thick grey solid line), thick disc (red solid line), metal-rich high-α sequence (blue dotted line), metal-poor low-α sequence (dash-dot green line), and metal-poor high-α sequence (dashed magenta line); the light grey lines represent the solar values. The binning structure is the same as in Fig. 7. The error bars represent the standard deviation associated with the mean value.
Current usage metrics show cumulative count of Article Views (full-text article views including HTML views, PDF and ePub downloads, according to the available data) and Abstracts Views on Vision4Press platform.
Data correspond to usage on the plateform after 2015. The current usage metrics is available 48-96 hours after online publication and is updated daily on week days.
Initial download of the metrics may take a while.