Fig. 6
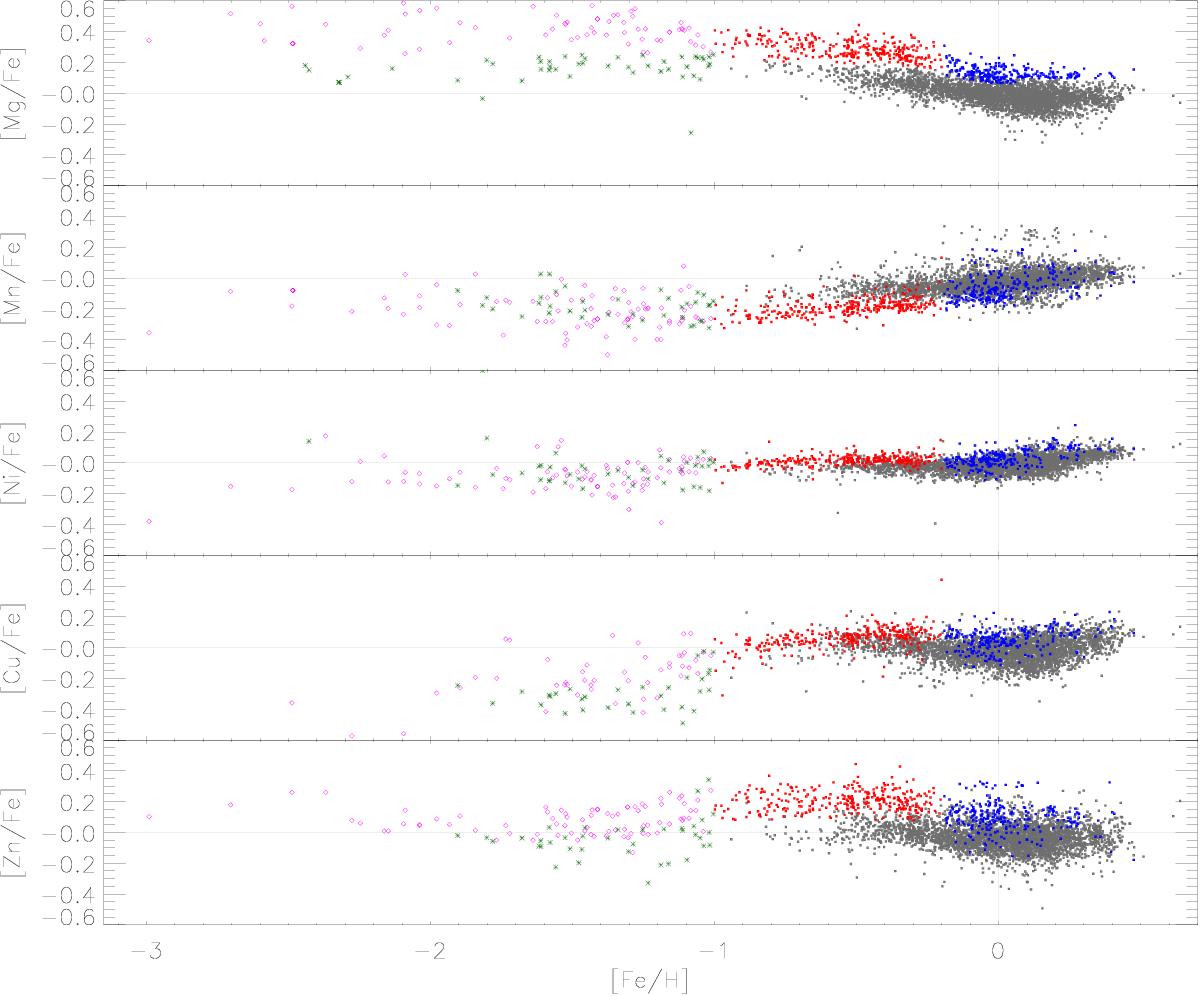
Observed element vs. iron abundance ratios as a function of the iron abundance. The different Galactic components defined in Sect. 3 are plotted: thin disc (grey dots), thick disc (red dots), metal-rich high-α sequence (blue dots), metal-poor low-α sequence (green asterisk), and metal-poor high-α sequence (magenta rhombus); the light grey lines represent the solar values.
Current usage metrics show cumulative count of Article Views (full-text article views including HTML views, PDF and ePub downloads, according to the available data) and Abstracts Views on Vision4Press platform.
Data correspond to usage on the plateform after 2015. The current usage metrics is available 48-96 hours after online publication and is updated daily on week days.
Initial download of the metrics may take a while.