Fig. 2
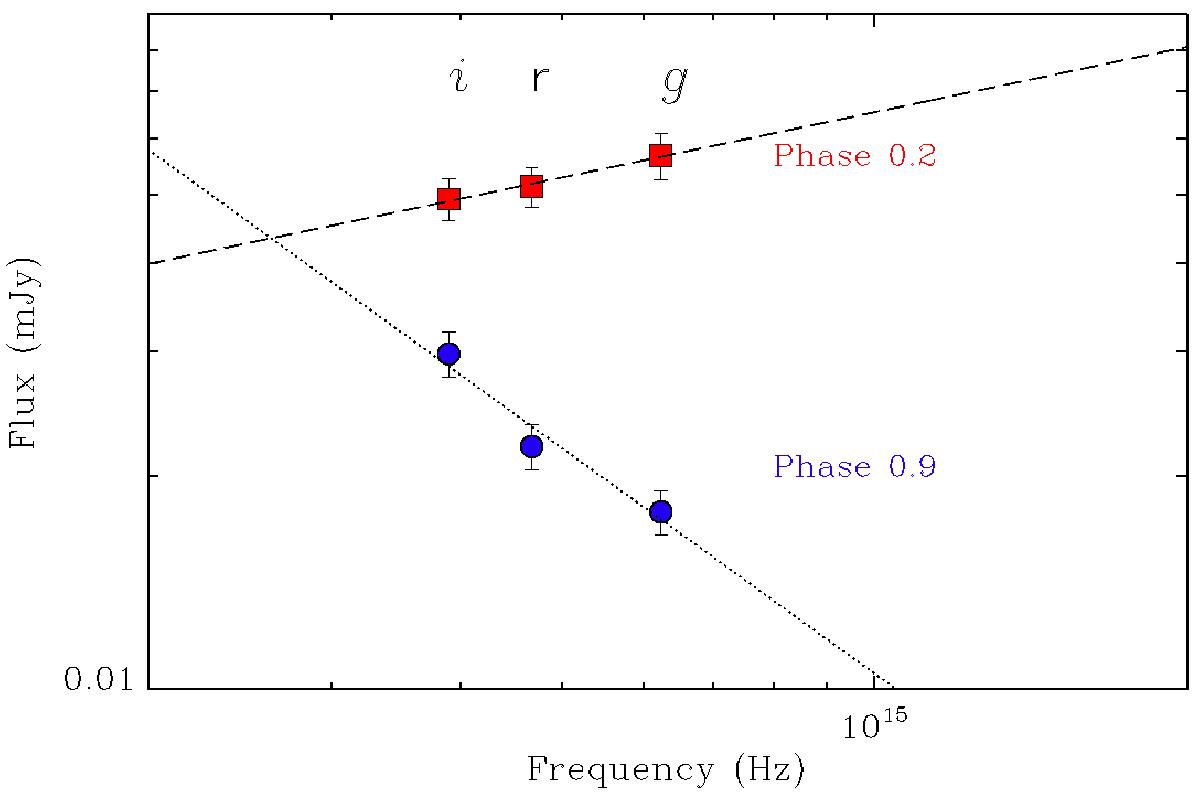
Spectral energy distributions (SED) of the system IGR J00291+5934 in two different epochs: phase 0.2 (red sqares) and phase 0.9 (blue dots). Phase 0.2 corresponds to a strong flare activity for the system. The fits of the two SEDs with a power law are shown (dashed and dotted lines, phase 0.2 and 0.9, respectively). Opposite behaviours can be observed (α = 0.31 ± 0.35 and α = −1.06 ± 0.35, respectively). All the points are corrected for reddening, the parameters of which are reported in Table 1.
Current usage metrics show cumulative count of Article Views (full-text article views including HTML views, PDF and ePub downloads, according to the available data) and Abstracts Views on Vision4Press platform.
Data correspond to usage on the plateform after 2015. The current usage metrics is available 48-96 hours after online publication and is updated daily on week days.
Initial download of the metrics may take a while.