Fig. 1
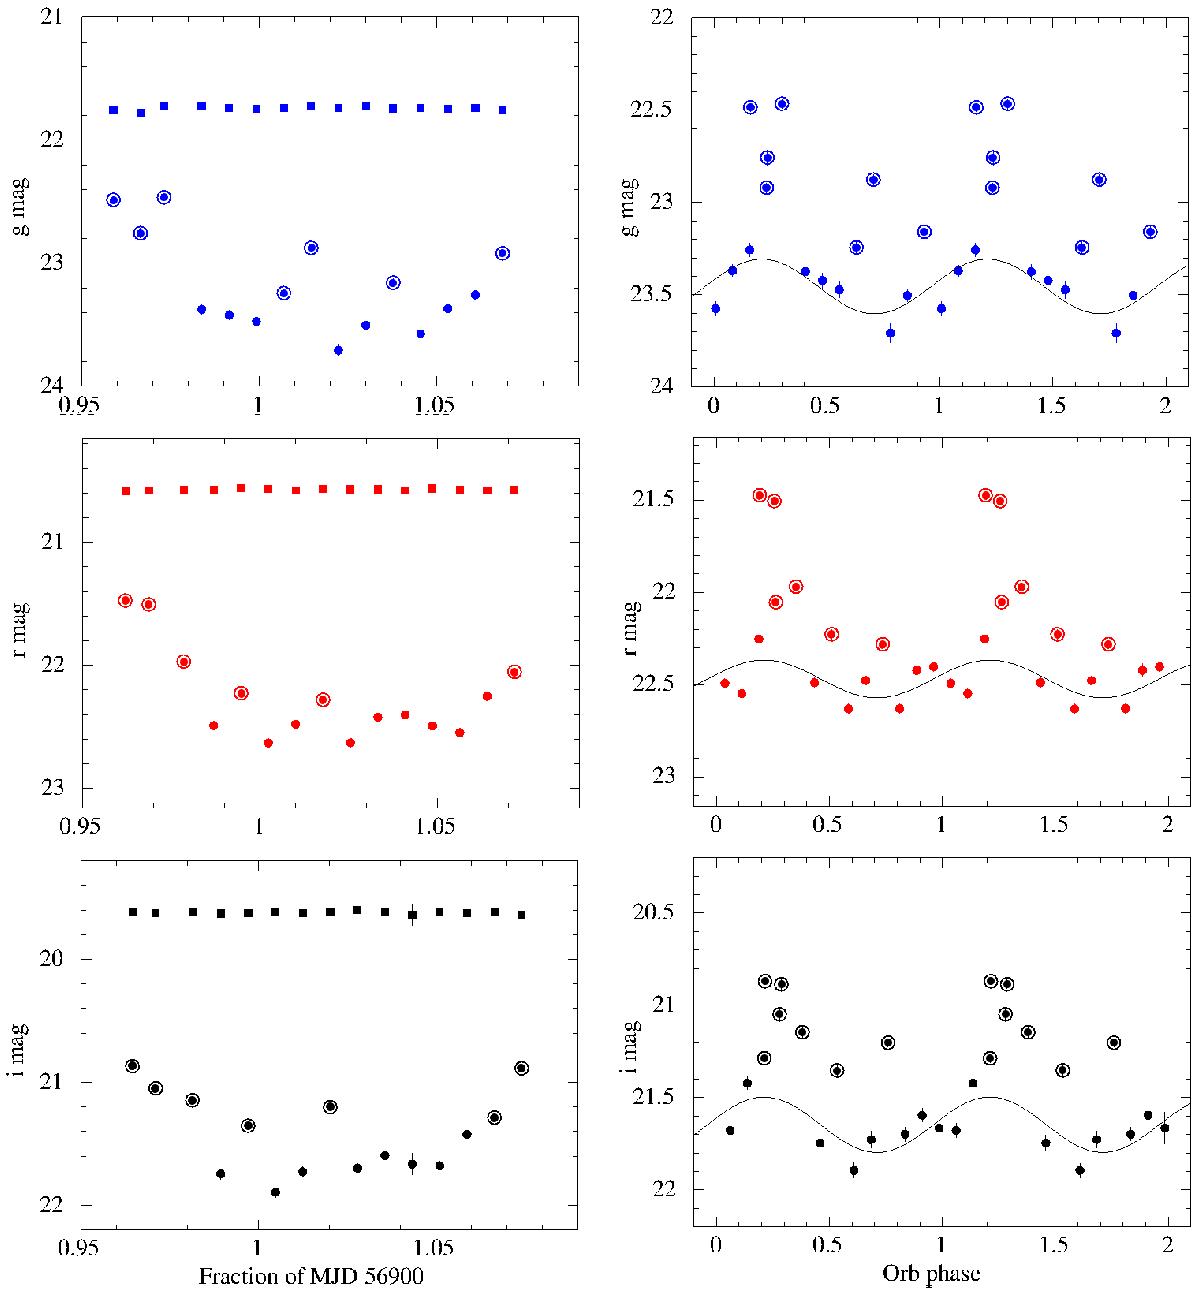
Left panel, from top to bottom: g, r, i light curves (mag vs. MJD) of the system IGR J00291+5934 (dots) and of a calibration star (squares). Circled dots represent the possible flaring activity. Right panel, from top to bottom: g, r, i light curves (mag vs. orbital phase) of the system IGR J00291+5934. Circled dots represent the points corresponding to the flaring activity. Superimposed on the light curves we sketch the constant plus sinusoidal fit of the data, carried out after filtering the flares and imposing the same phase on all the light curves and with the period fixed to 1. In the r-band, the point corresponding to phase 0.73 is considered as a flare for continuity with the other bands. Phase 0 corresponds to the inferior conjunction of the companion star. We evaluated the phases based on the X-ray ephemerides of Galloway et al. (2005). Two periods of the system are drawn for clarity.
Current usage metrics show cumulative count of Article Views (full-text article views including HTML views, PDF and ePub downloads, according to the available data) and Abstracts Views on Vision4Press platform.
Data correspond to usage on the plateform after 2015. The current usage metrics is available 48-96 hours after online publication and is updated daily on week days.
Initial download of the metrics may take a while.