Fig. A.2
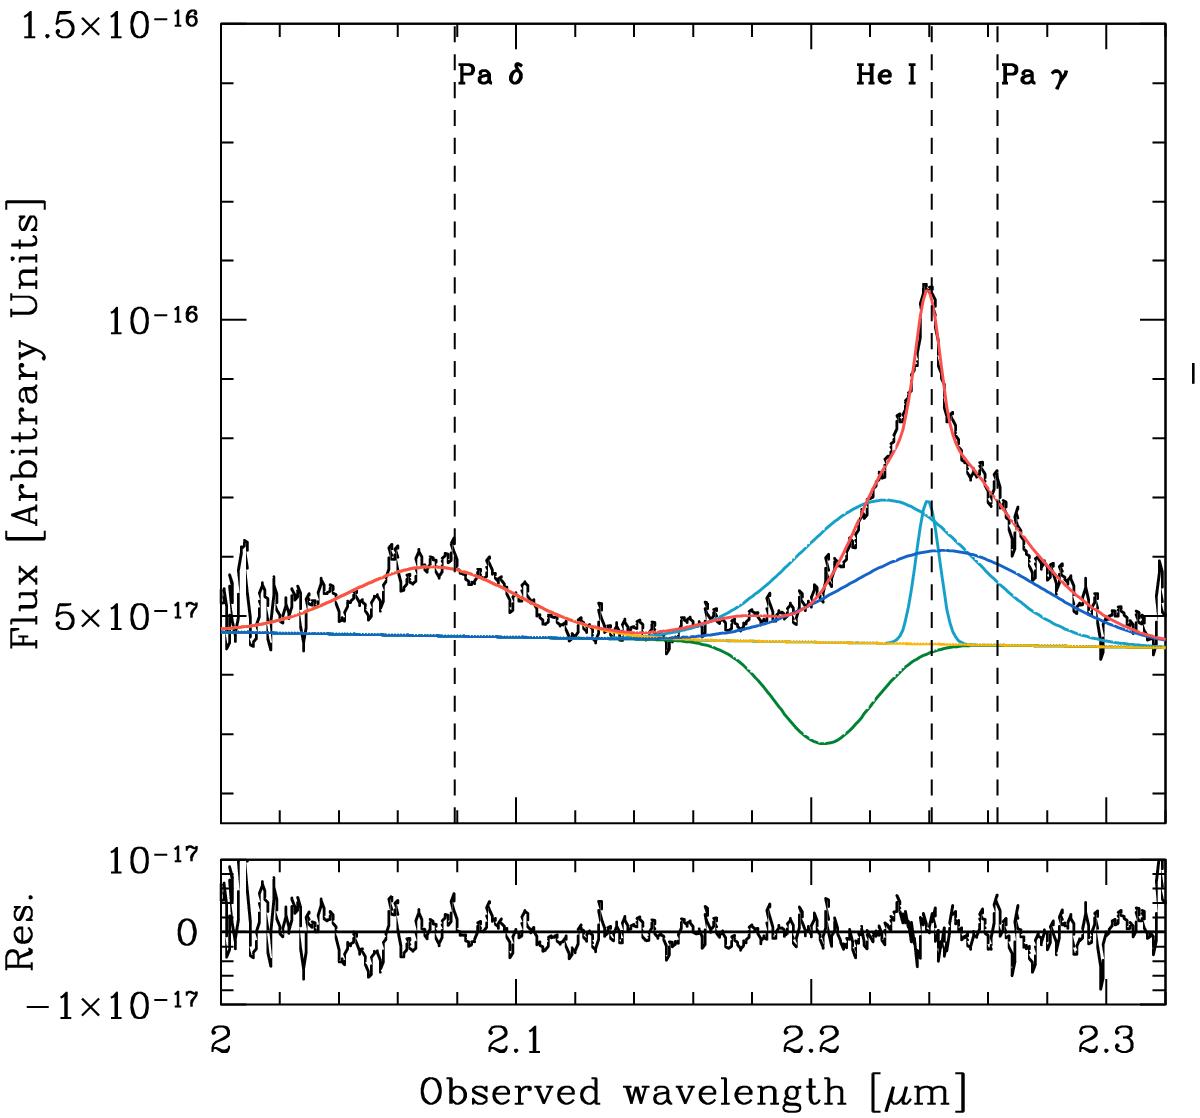
Palomar TripleSpec spectrum (order 3). Wavelengths are in the observer’s frame. Relevant lines are labeled at the top of the panel. The vertical dashed lines indicate the wavelengths of the lines corresponding to the systemic redshift zh = 1.0685. The best fit is the red line. Each component of the model is shown separately, added to the continuum power law, for clarity. The emission components are shown in cyan and blue for He I and Pa γ, respectively. The absorption component is plotted in green. Model residuals are shown in the bottom panel.
Current usage metrics show cumulative count of Article Views (full-text article views including HTML views, PDF and ePub downloads, according to the available data) and Abstracts Views on Vision4Press platform.
Data correspond to usage on the plateform after 2015. The current usage metrics is available 48-96 hours after online publication and is updated daily on week days.
Initial download of the metrics may take a while.