Fig. 4
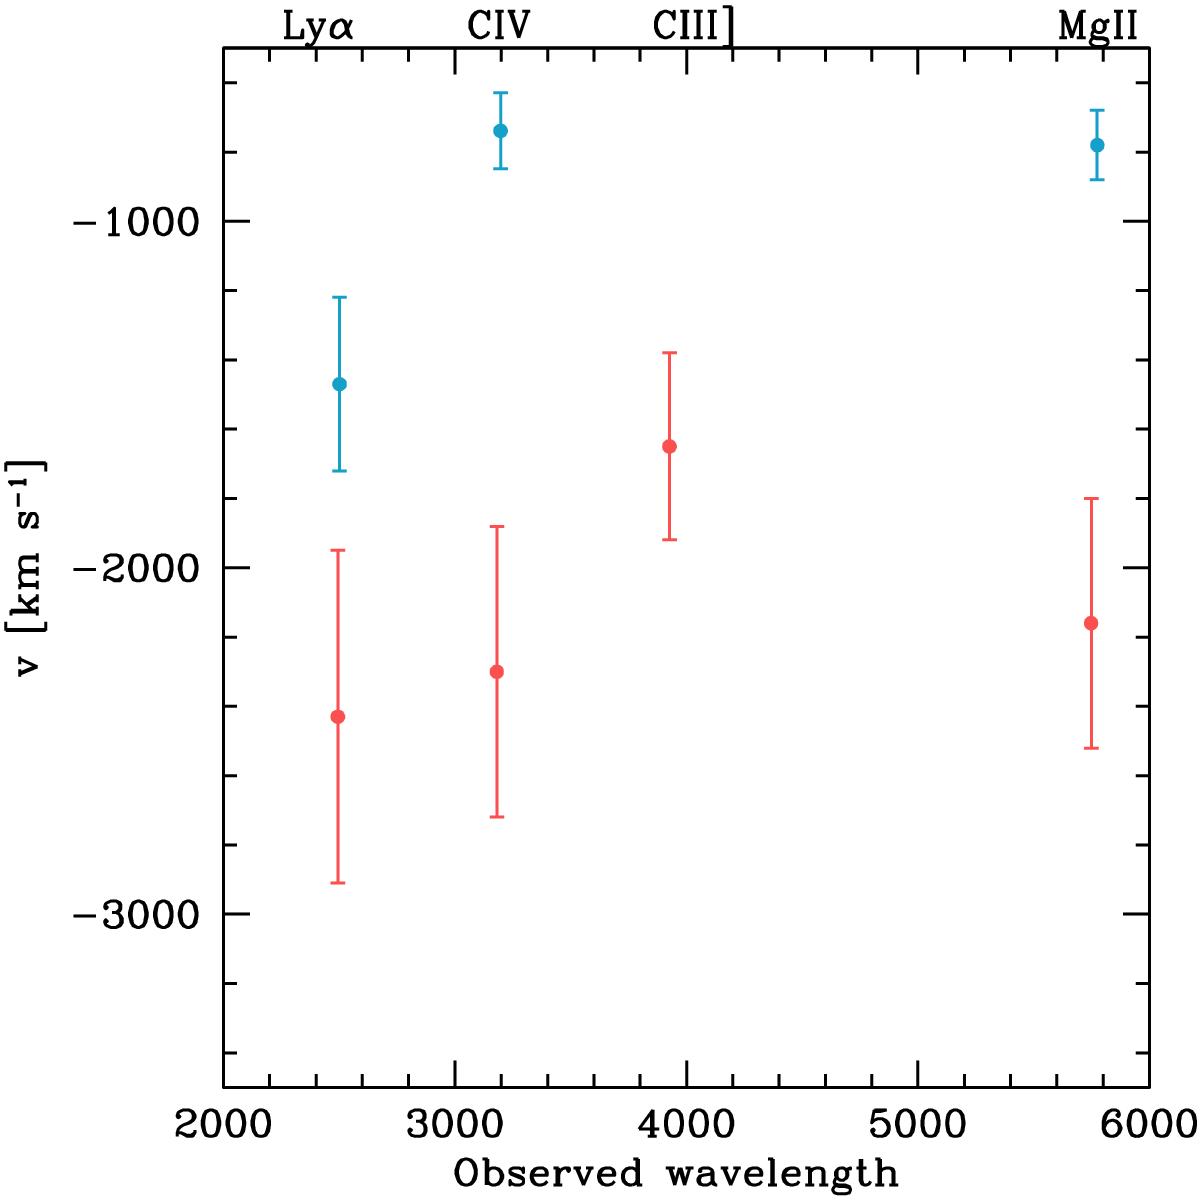
Velocity offsets of the broad emission lines as measured with respect to the systemic redshift zh plotted against the observed wavelength of each line. The light blue points and the red points are for the spectral models without and with broad absorption, respectively. Note that there is only one point representing the C III] line because for semi-forbidden lines broad absorption is not expected.
Current usage metrics show cumulative count of Article Views (full-text article views including HTML views, PDF and ePub downloads, according to the available data) and Abstracts Views on Vision4Press platform.
Data correspond to usage on the plateform after 2015. The current usage metrics is available 48-96 hours after online publication and is updated daily on week days.
Initial download of the metrics may take a while.