Fig. 3
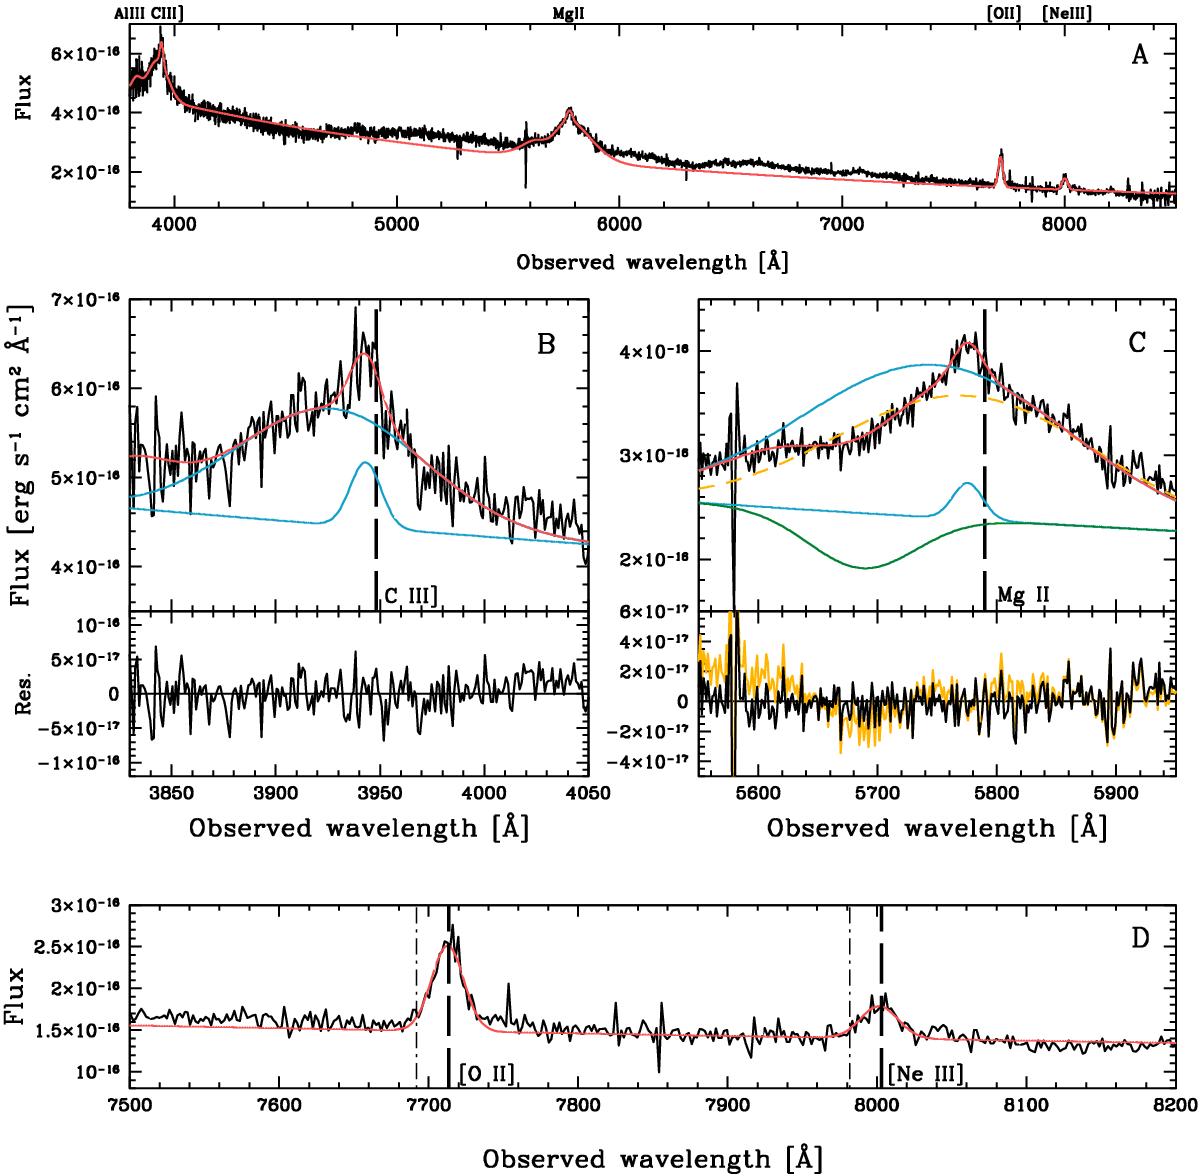
Same as in Fig. 2 but for the SDSS optical spectrum. Panels B) and C) show the regions of C III] and Mg II, respectively. Note that the continuum in the region of the Mg II line (between ~5000 Å and 7000 Å) is not reproduced by the fit because of the presence of Fe II features. The best fit is the red line. Each component of the model is also shown, as in Fig. 2. The emission components are shown in blue and the absorption components are shown in green. Broad components of the best fit derived without including broad absorption are shown as yellow dashed lines. The model residuals are also shown at the bottom of panels B) and C). The yellow lines refer to the model without broad absorption. The thick dashed vertical lines correspond to the wavelength of each line at the systemic redshift measured from the narrow lines (see panel D)). Panel D) shows the spectral region of the two isolated [O II]3727 and [Ne III]3869 narrow lines. The dot-dashed lines in panel D) indicate the wavelength of these lines corresponding to the redshift of the source estimated by Kuraszkiewicz et al. (2002, see Sect. 3.2.3 for more details).
Current usage metrics show cumulative count of Article Views (full-text article views including HTML views, PDF and ePub downloads, according to the available data) and Abstracts Views on Vision4Press platform.
Data correspond to usage on the plateform after 2015. The current usage metrics is available 48-96 hours after online publication and is updated daily on week days.
Initial download of the metrics may take a while.