Fig. 2
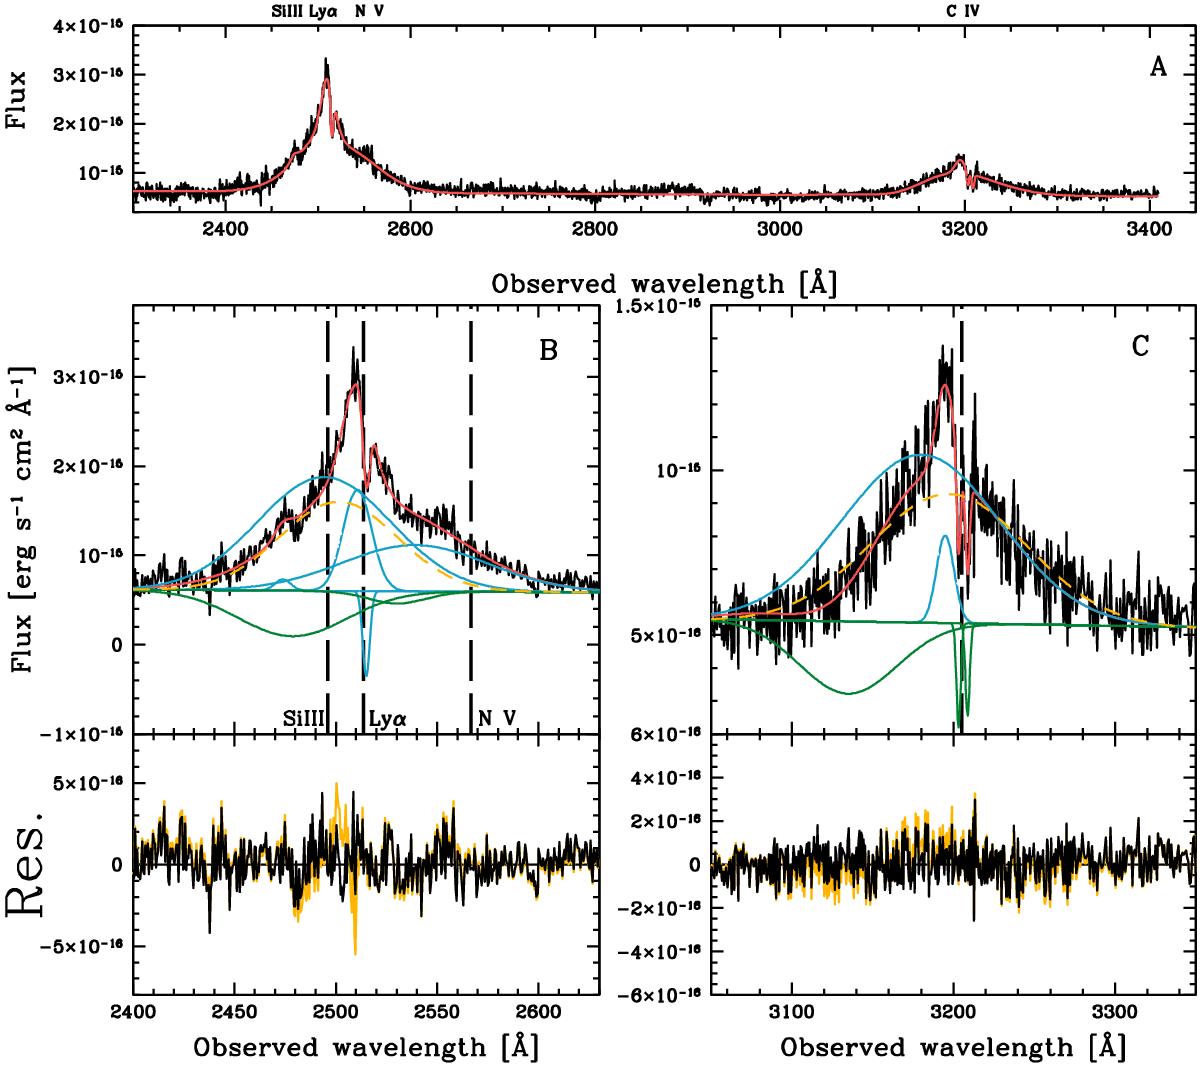
HST/FOS UV spectrum. Wavelengths are in the observer’s frame. In the top panel A) we show the full spectrum and the best-fit model (red line). Relevant lines are labeled on top of the panel, at the corresponding observed wavelength. The lower panels show zoomed-in regions for each of the lines discussed in the text. Panels B) and C) show the regions of the Lyα complex and C IV, respectively. The best fit is the red line. Each component of the model is shown separately, added to the continuum power law, for clarity. The emission components are shown in blue and the absorption components are shown in green. Broad components of the best fit derived without including broad absorption are shown as yellow dashed lines. The model residuals are also shown at the bottom of panels B) and C). The yellow lines refer to the model without broad absorption. The thick dashed vertical lines correspond to the wavelength of each line at the systemic redshift measured from the narrow lines (see Fig. 3, panel D)).
Current usage metrics show cumulative count of Article Views (full-text article views including HTML views, PDF and ePub downloads, according to the available data) and Abstracts Views on Vision4Press platform.
Data correspond to usage on the plateform after 2015. The current usage metrics is available 48-96 hours after online publication and is updated daily on week days.
Initial download of the metrics may take a while.