Fig. 15
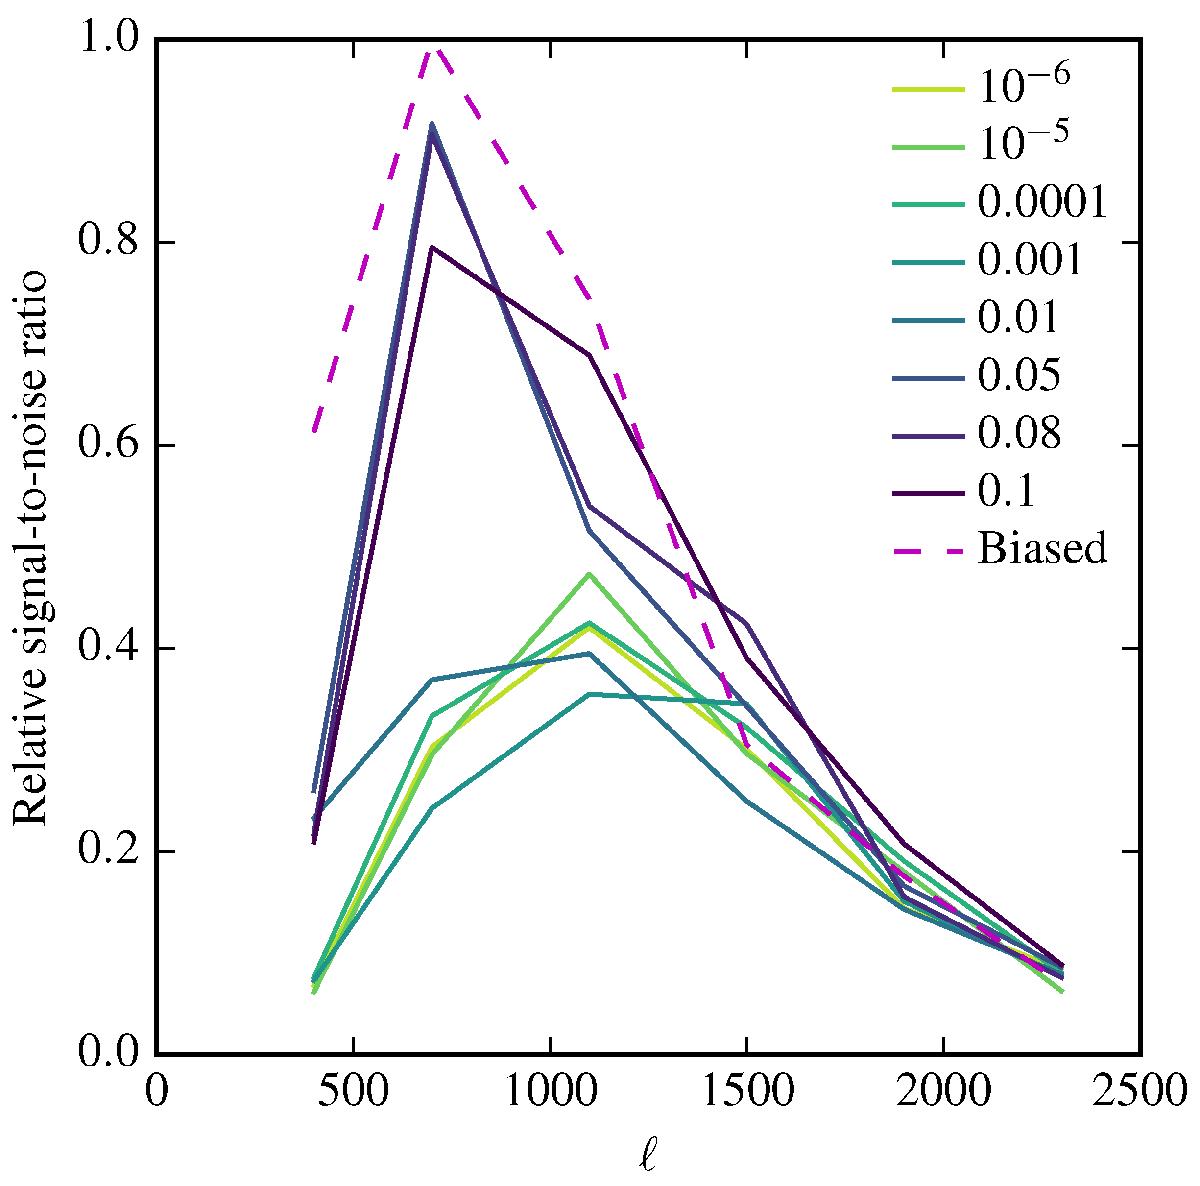
Ratio between the signal and the total uncertainty for B-mode power spectra derived with the different power spectrum estimation choices. The results are quoted relative to the highest ratio obtained for the biased map. The loss of precision of the spectra derived from the unbiased map is apparent and related to the strong correlated noise modes present in the map. The loss can be mostly recovered with help of a progressively more aggressive removal of the noisiest modes as expressed by the increasing value of parameter α as defined in the text and given in the legend.
Current usage metrics show cumulative count of Article Views (full-text article views including HTML views, PDF and ePub downloads, according to the available data) and Abstracts Views on Vision4Press platform.
Data correspond to usage on the plateform after 2015. The current usage metrics is available 48-96 hours after online publication and is updated daily on week days.
Initial download of the metrics may take a while.