Fig. 12
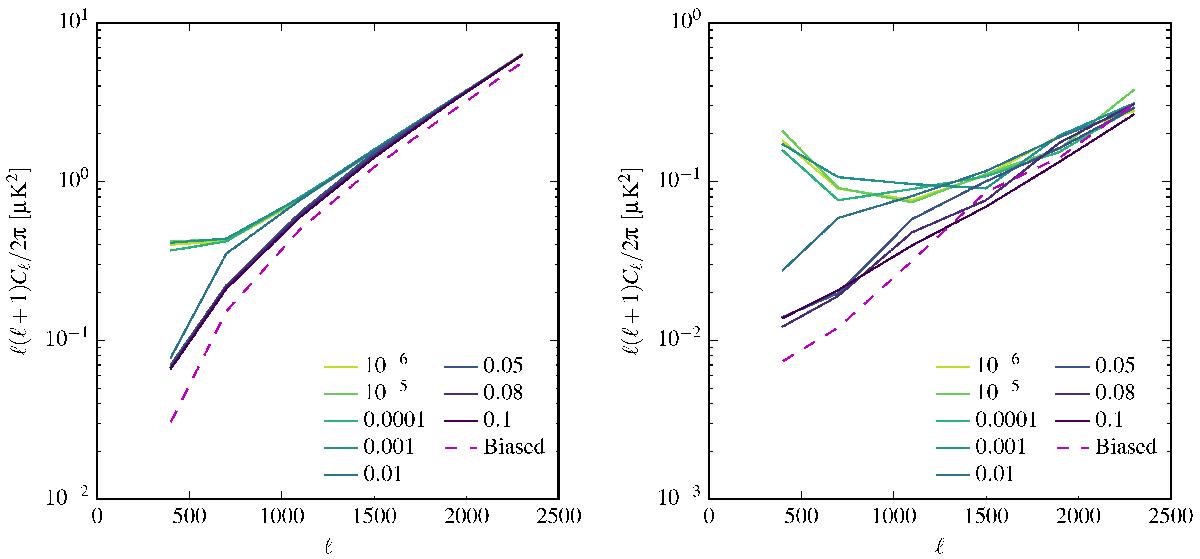
Mean (left) and standard deviation (right) of the B-mode power spectra (as computed by X2Pure) of 100 noise only simulations for different input maps. “Biased” refers to the biased map estimator defined in Eq. (25). The other lines refer to different maps derived from the unbiased map estimator Eq. (22). The value in the legend is the α parameter that quantifies the amount of map domain filtering applied to the unbiased map. Higher values of α correspond to more aggressive filtering, see Sect. 6.3.1 for more details.
Current usage metrics show cumulative count of Article Views (full-text article views including HTML views, PDF and ePub downloads, according to the available data) and Abstracts Views on Vision4Press platform.
Data correspond to usage on the plateform after 2015. The current usage metrics is available 48-96 hours after online publication and is updated daily on week days.
Initial download of the metrics may take a while.