Fig. 9
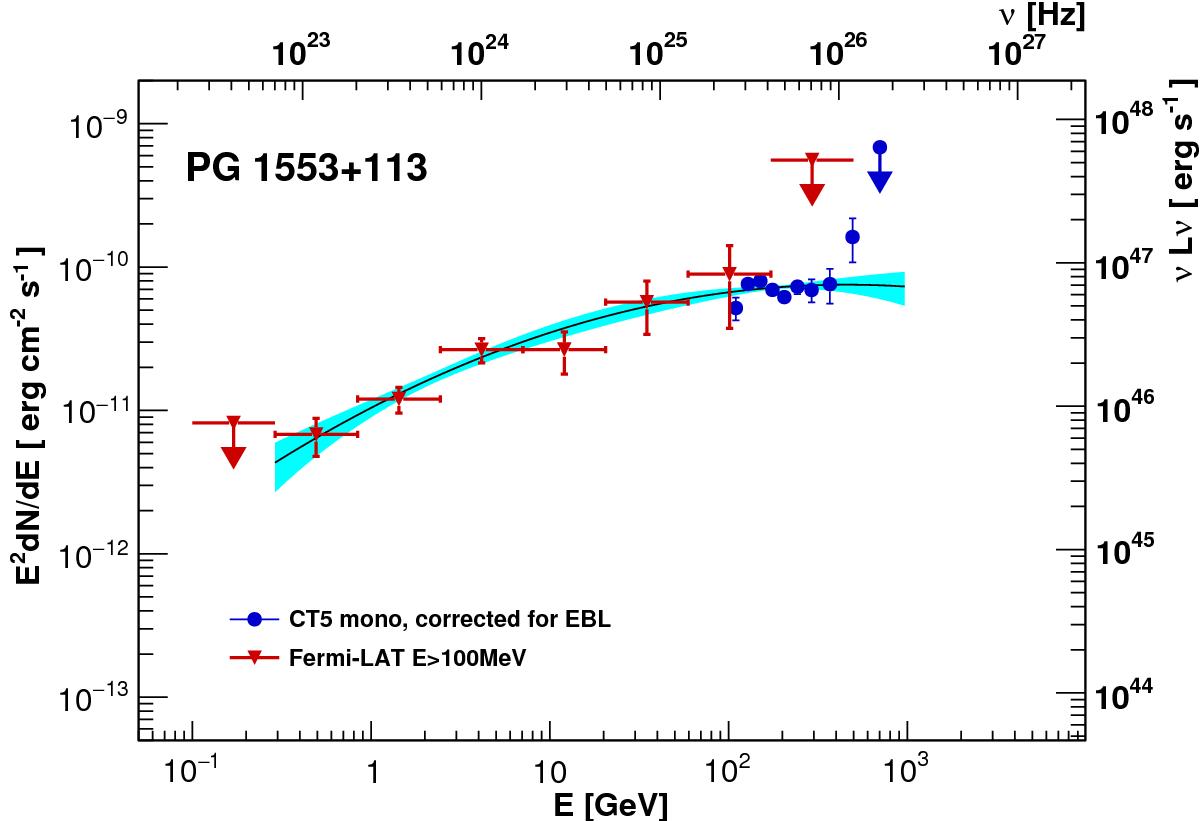
Energy spectrum of PG 1553+113 obtained from the H.E.S.S. II mono analysis (blue) corrected for EBL absorption in comparison with the contemporaneous Fermi-LAT data with a minimal energy of 0.1 GeV (red). The assumed redshift is z = 0.49. The black line is the best-fit log-parabola model fit to the points and the cyan butterfly indicates the 1σ (statistical error only) uncertainty region. The right-hand y-axis shows the equivalent isotropic luminosity (not beaming corrected).
Current usage metrics show cumulative count of Article Views (full-text article views including HTML views, PDF and ePub downloads, according to the available data) and Abstracts Views on Vision4Press platform.
Data correspond to usage on the plateform after 2015. The current usage metrics is available 48-96 hours after online publication and is updated daily on week days.
Initial download of the metrics may take a while.