Fig. 7
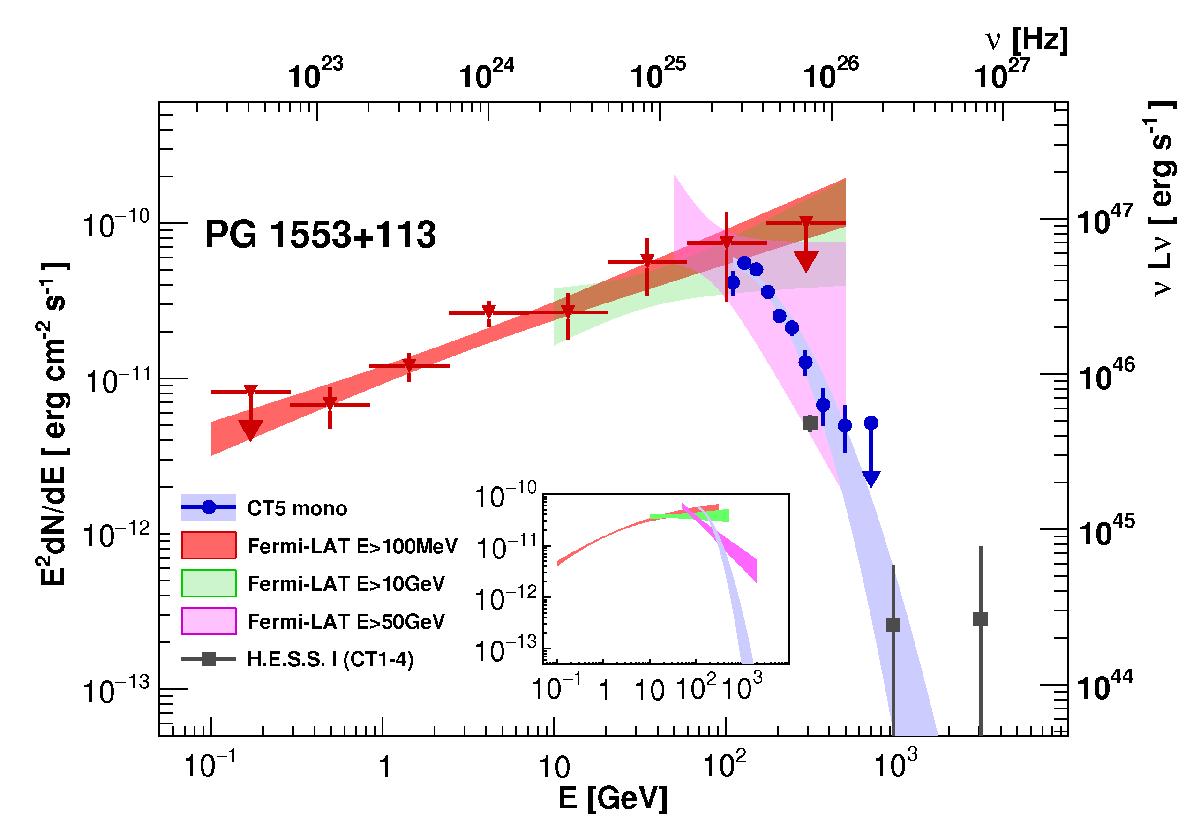
Energy spectrum of PG 1553+113 obtained from the H.E.S.S. II mono analysis (blue) in comparison with the contemporaneous Fermi-LAT data with an energy threshold of 0.1 GeV (red triangles and confidence band), 10 GeV (green band), and 50 GeV (purple band) and contemporaneous CT1–4 data (grey squares). In all cases the bands shown represent the 1σ confidence region. The right-hand y-axis shows the equivalent isotropic luminosity (not corrected for beaming or EBL absorption) assuming redshift z = 0.49. The inset compares the H.E.S.S. confidence band with the Fermi-LAT catalogue data (3FGL, 1FHL and 2FHL, see Sect. 4.4.2).
Current usage metrics show cumulative count of Article Views (full-text article views including HTML views, PDF and ePub downloads, according to the available data) and Abstracts Views on Vision4Press platform.
Data correspond to usage on the plateform after 2015. The current usage metrics is available 48-96 hours after online publication and is updated daily on week days.
Initial download of the metrics may take a while.