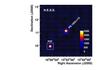
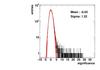
Fig. 5
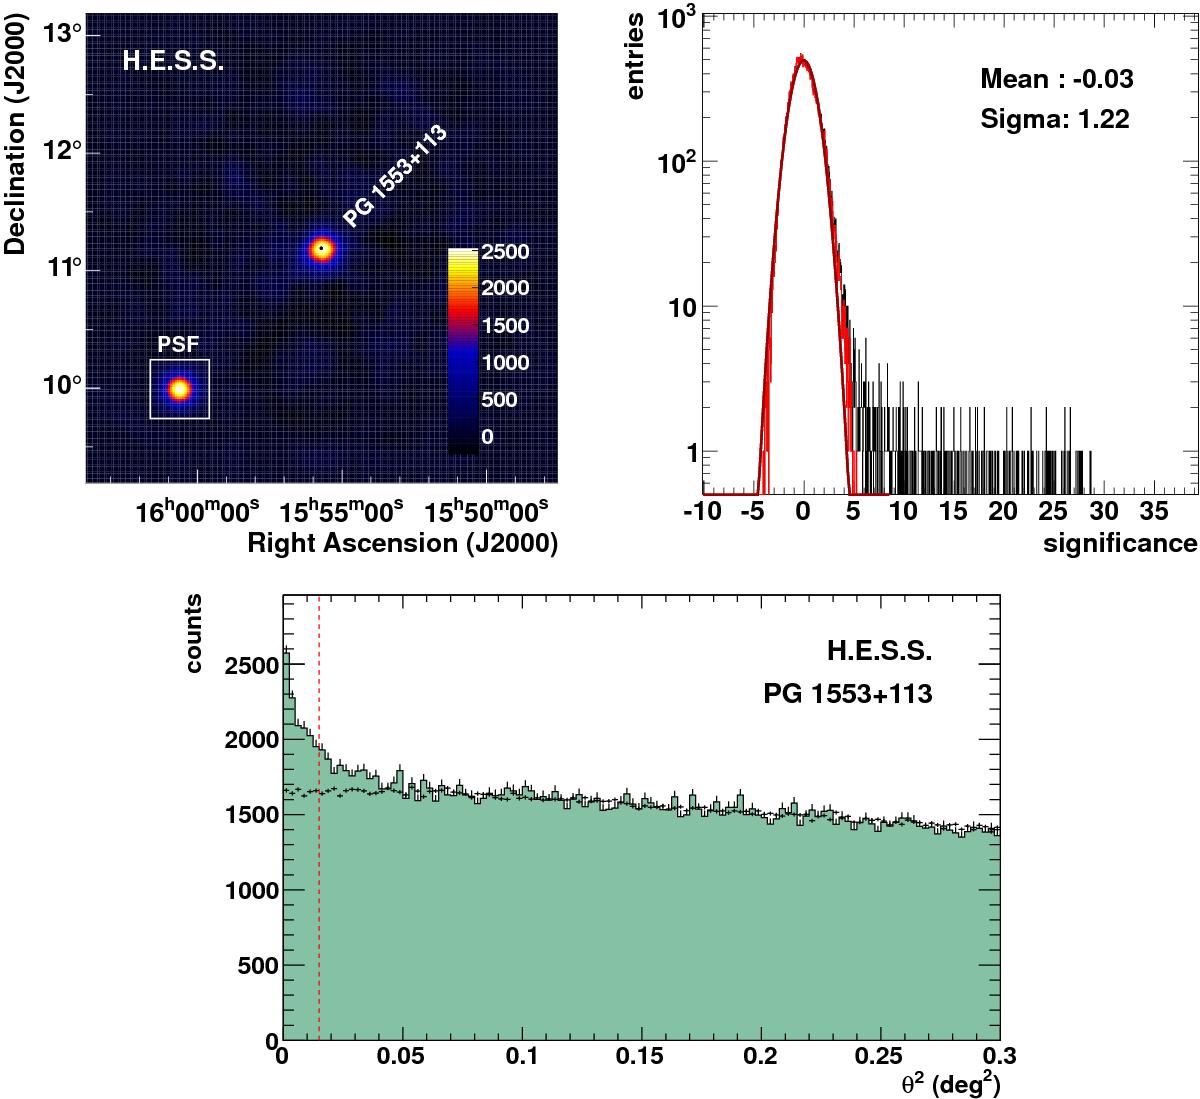
Top: (Left) excess map of events observed in the direction of PG 1553+113 using the H.E.S.S. II mono analysis (16.8 h live time). The source position is indicated by a black dot. Right: significance distribution that corresponds to the excess map. The meaning of the histograms and statistics data is the same as in Fig. 1. Bottom: θ2 distribution for PG 1553+113. The meaning of the data shown is the same as in Fig. 1. The vertical dashed line shows the limit of the on-source region. The energy threshold for this analysis is ≈100 GeV.
Current usage metrics show cumulative count of Article Views (full-text article views including HTML views, PDF and ePub downloads, according to the available data) and Abstracts Views on Vision4Press platform.
Data correspond to usage on the plateform after 2015. The current usage metrics is available 48-96 hours after online publication and is updated daily on week days.
Initial download of the metrics may take a while.