Fig. 1
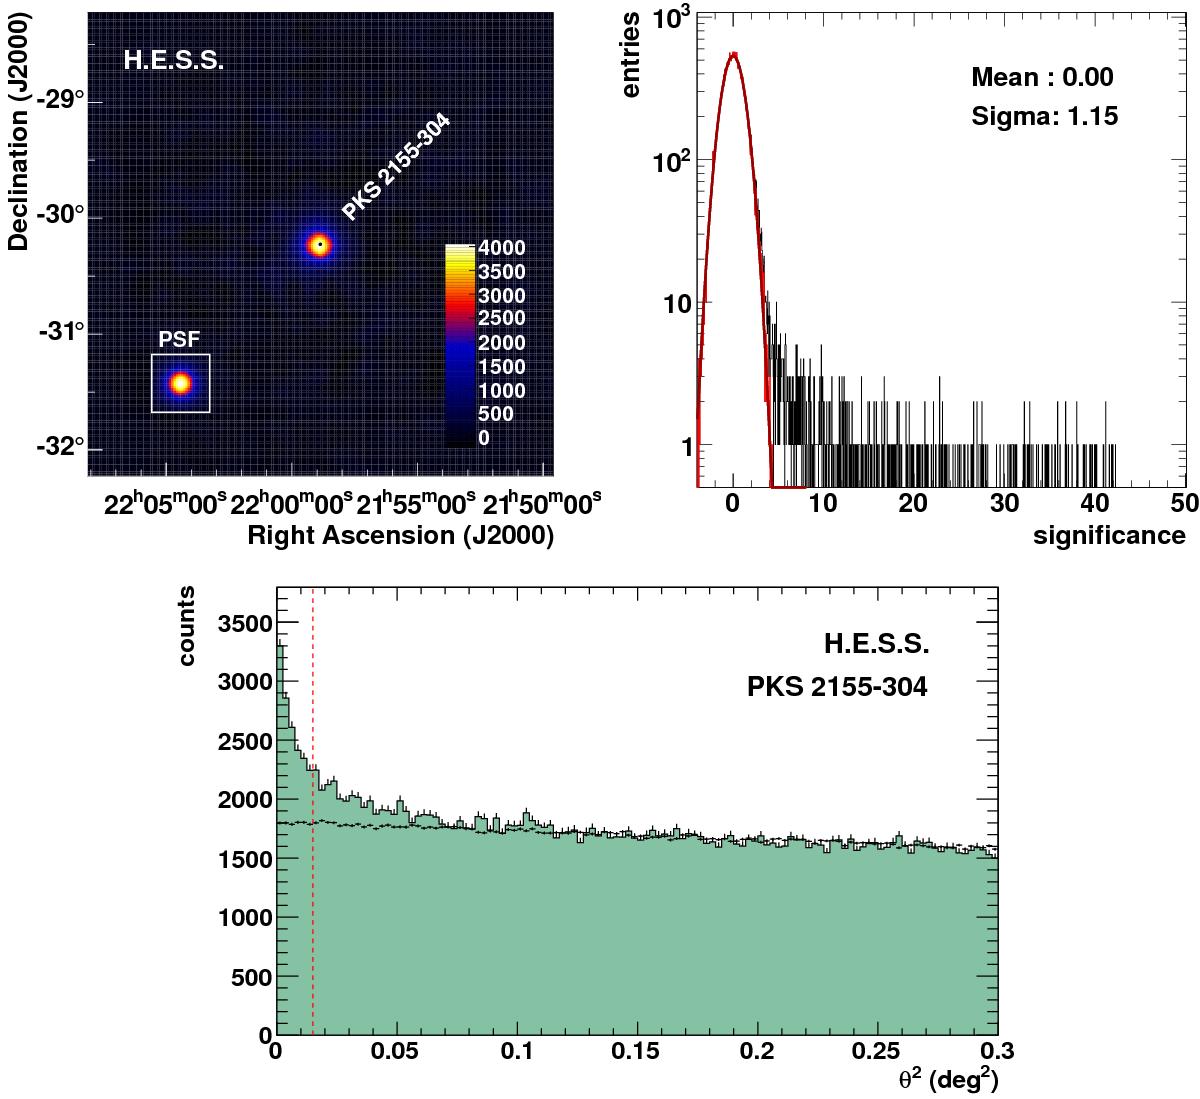
Top: (left) excess map of events observed in the direction of PKS 2155−304 using the H.E.S.S. II mono analysis (2013–2014 data). The inset represents the point spread function of the instrument obtained from simulations. The source position is indicated by a black dot. Right: significance distribution that corresponds to the excess map (black histogram). The distribution obtained by excluding a circular region of 0.3° radius around the source is shown in red; the results of a Gaussian fit to this distribution are also shown. Bottom: distribution of θ2 (squared angular distance to PKS 2155−304) for gamma-like events obtained with the H.E.S.S. II mono analysis (filled histogram) in comparison with the normalised θ2 distribution for off-source regions (black points). The vertical dashed line shows the limit of the on-source region. The energy threshold for this analysis is ≈80 GeV.
Current usage metrics show cumulative count of Article Views (full-text article views including HTML views, PDF and ePub downloads, according to the available data) and Abstracts Views on Vision4Press platform.
Data correspond to usage on the plateform after 2015. The current usage metrics is available 48-96 hours after online publication and is updated daily on week days.
Initial download of the metrics may take a while.