Free Access
Fig. 6
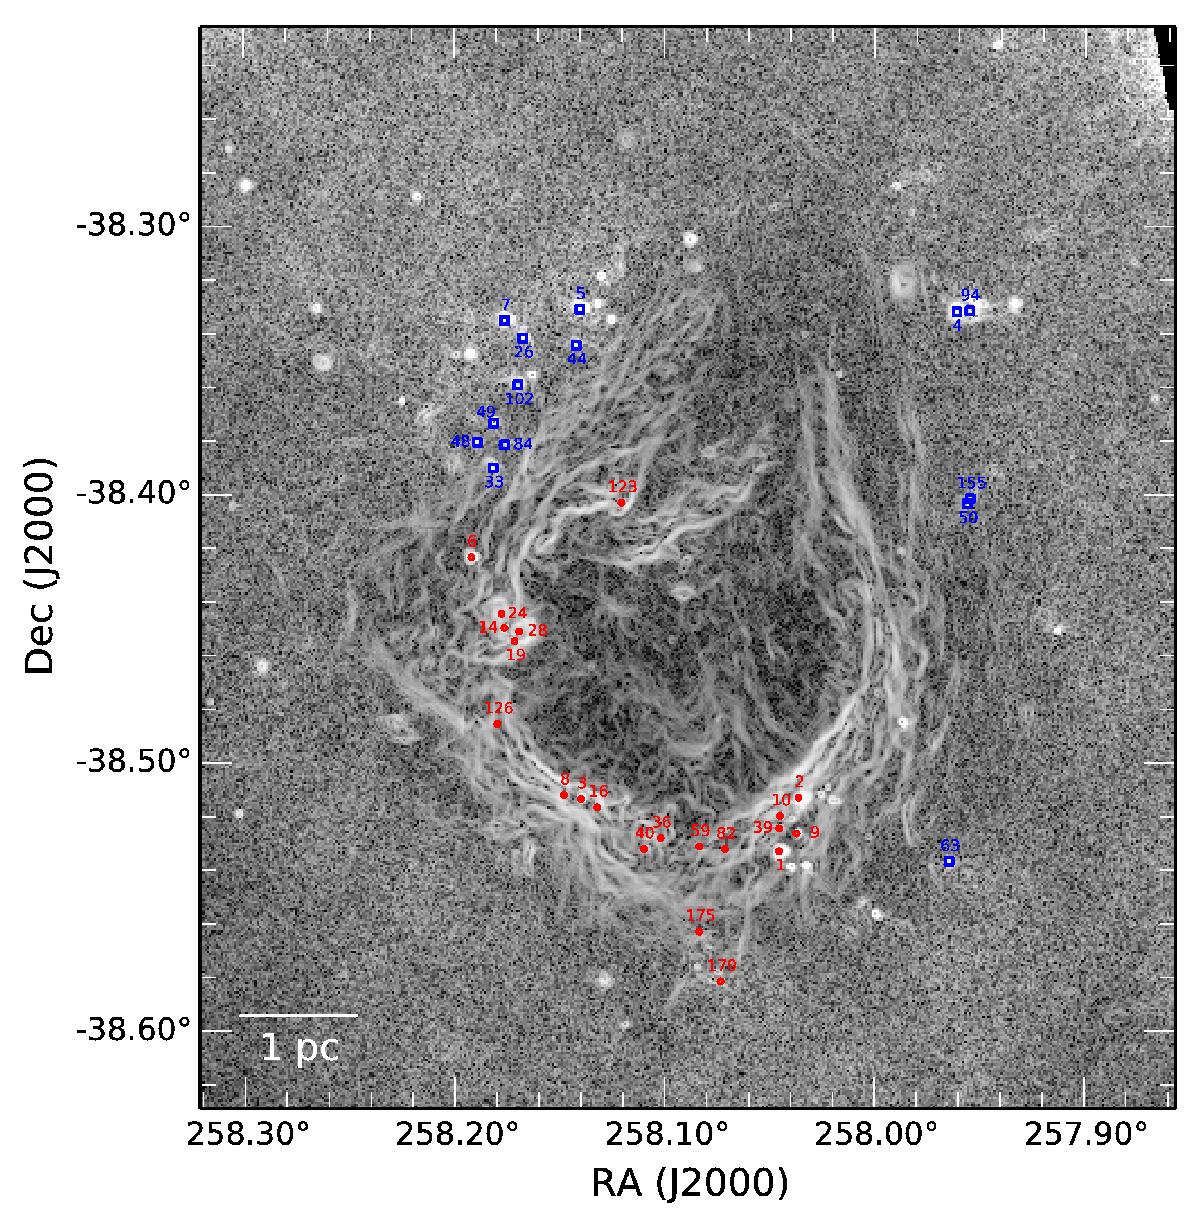
All 35 compact sources detected using getsources (and discussed in the text) superimposed on a 70 μm gradient image of RCW 120. The sources are color-coded depending on their location: red circles for sources observed towards the PDR, blue squares for sources outside (see text).
Current usage metrics show cumulative count of Article Views (full-text article views including HTML views, PDF and ePub downloads, according to the available data) and Abstracts Views on Vision4Press platform.
Data correspond to usage on the plateform after 2015. The current usage metrics is available 48-96 hours after online publication and is updated daily on week days.
Initial download of the metrics may take a while.