Fig. 5
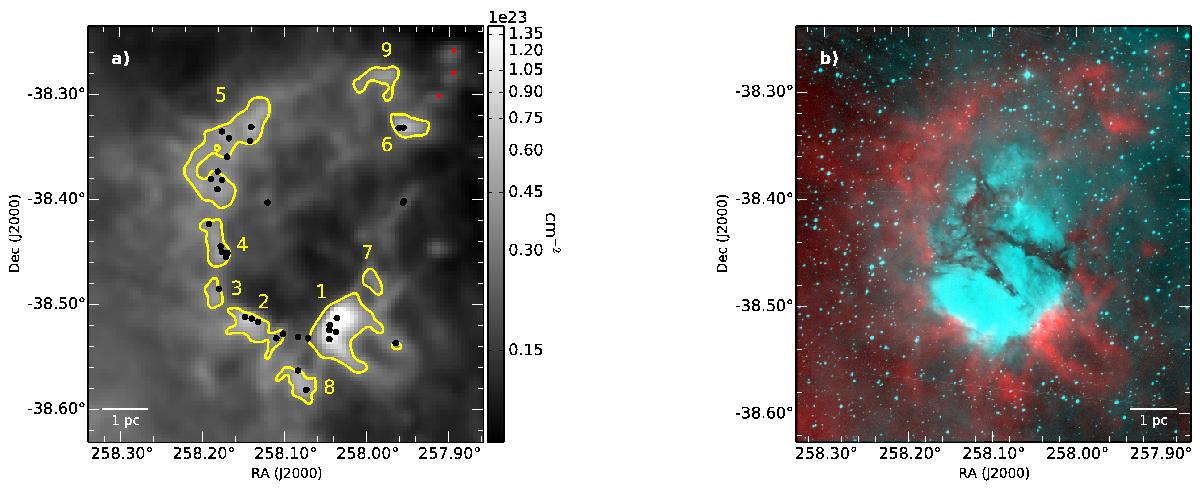
a) On logarithmic scale, H2 column density map of RCW 120 at 36![]() 6 resolution with 870 μm emission from LABOCA (in yellow countours), the final sample of sources (black dots) and the three prestellar clumps (red dots). Condensations observed at 870 μm are identified following the labelling in DEH09. The density values range from 7 × 1021 cm-2 to 4 × 1023 cm-2. b) High resolution H2 column density map of RCW 120 at 18
6 resolution with 870 μm emission from LABOCA (in yellow countours), the final sample of sources (black dots) and the three prestellar clumps (red dots). Condensations observed at 870 μm are identified following the labelling in DEH09. The density values range from 7 × 1021 cm-2 to 4 × 1023 cm-2. b) High resolution H2 column density map of RCW 120 at 18![]() 2 resolution (in red) and Hα emission (in blue) from the SuperCOSMOS Hα Survey. The column density values range from 7 × 1021 cm-2 to 9.4 × 1023 cm-2.
2 resolution (in red) and Hα emission (in blue) from the SuperCOSMOS Hα Survey. The column density values range from 7 × 1021 cm-2 to 9.4 × 1023 cm-2.
Current usage metrics show cumulative count of Article Views (full-text article views including HTML views, PDF and ePub downloads, according to the available data) and Abstracts Views on Vision4Press platform.
Data correspond to usage on the plateform after 2015. The current usage metrics is available 48-96 hours after online publication and is updated daily on week days.
Initial download of the metrics may take a while.