Fig. 4
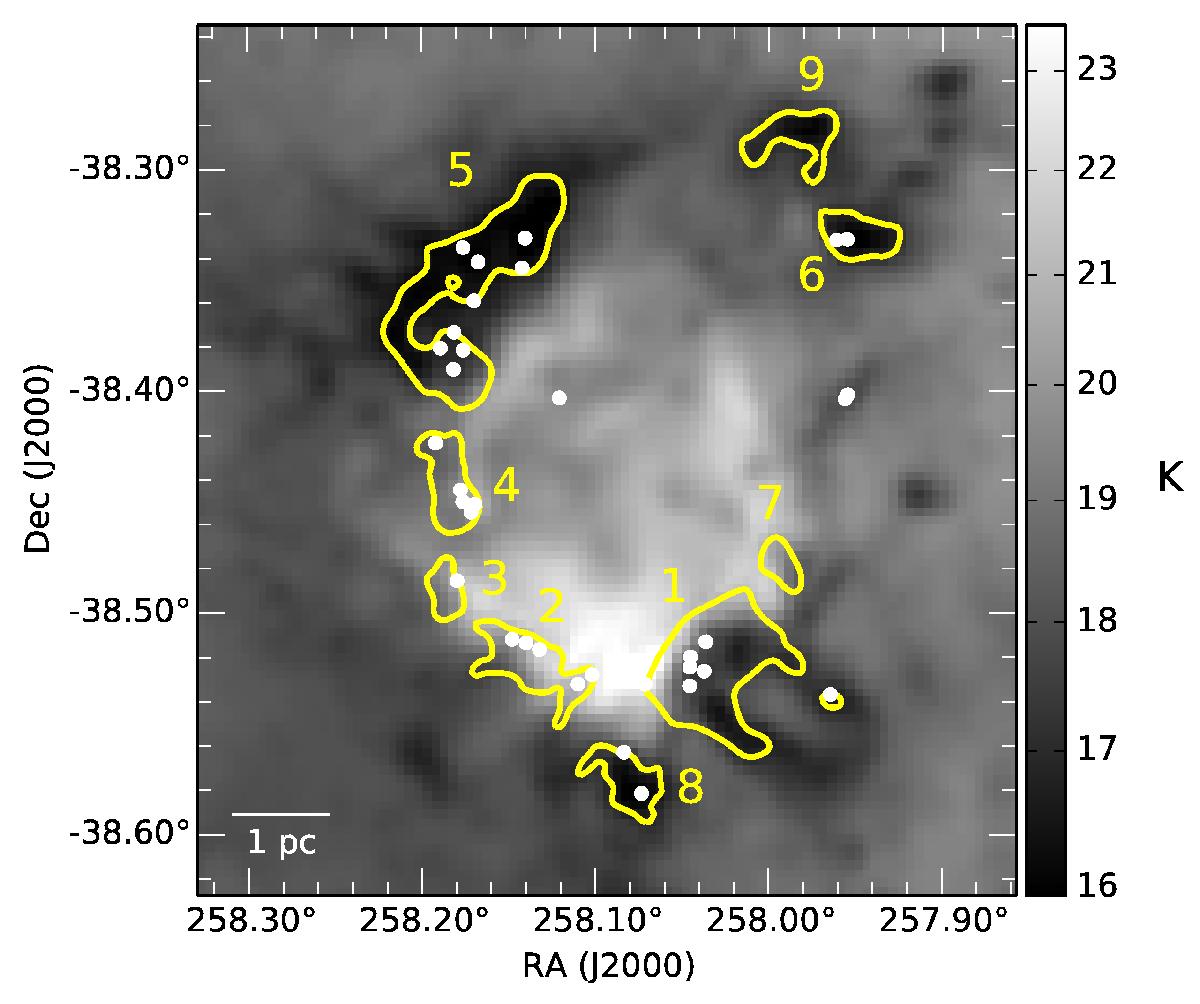
Temperature map of RCW 120 at 36.̋6 resolution with 870 μm emission from LABOCA (in yellow countours) and the final sample of 35 compact sources (white dots) discussed in this paper. Condensations observed at 870 μm are identified following the labelling in DEH09. The temperature ranges from 15 K (dark) to 24 K (white). Warm regions are observed towards the ionized zone. Colder regions are located outside the ionized region and are distributed in cores, filaments and condensations.
Current usage metrics show cumulative count of Article Views (full-text article views including HTML views, PDF and ePub downloads, according to the available data) and Abstracts Views on Vision4Press platform.
Data correspond to usage on the plateform after 2015. The current usage metrics is available 48-96 hours after online publication and is updated daily on week days.
Initial download of the metrics may take a while.