Fig. 19
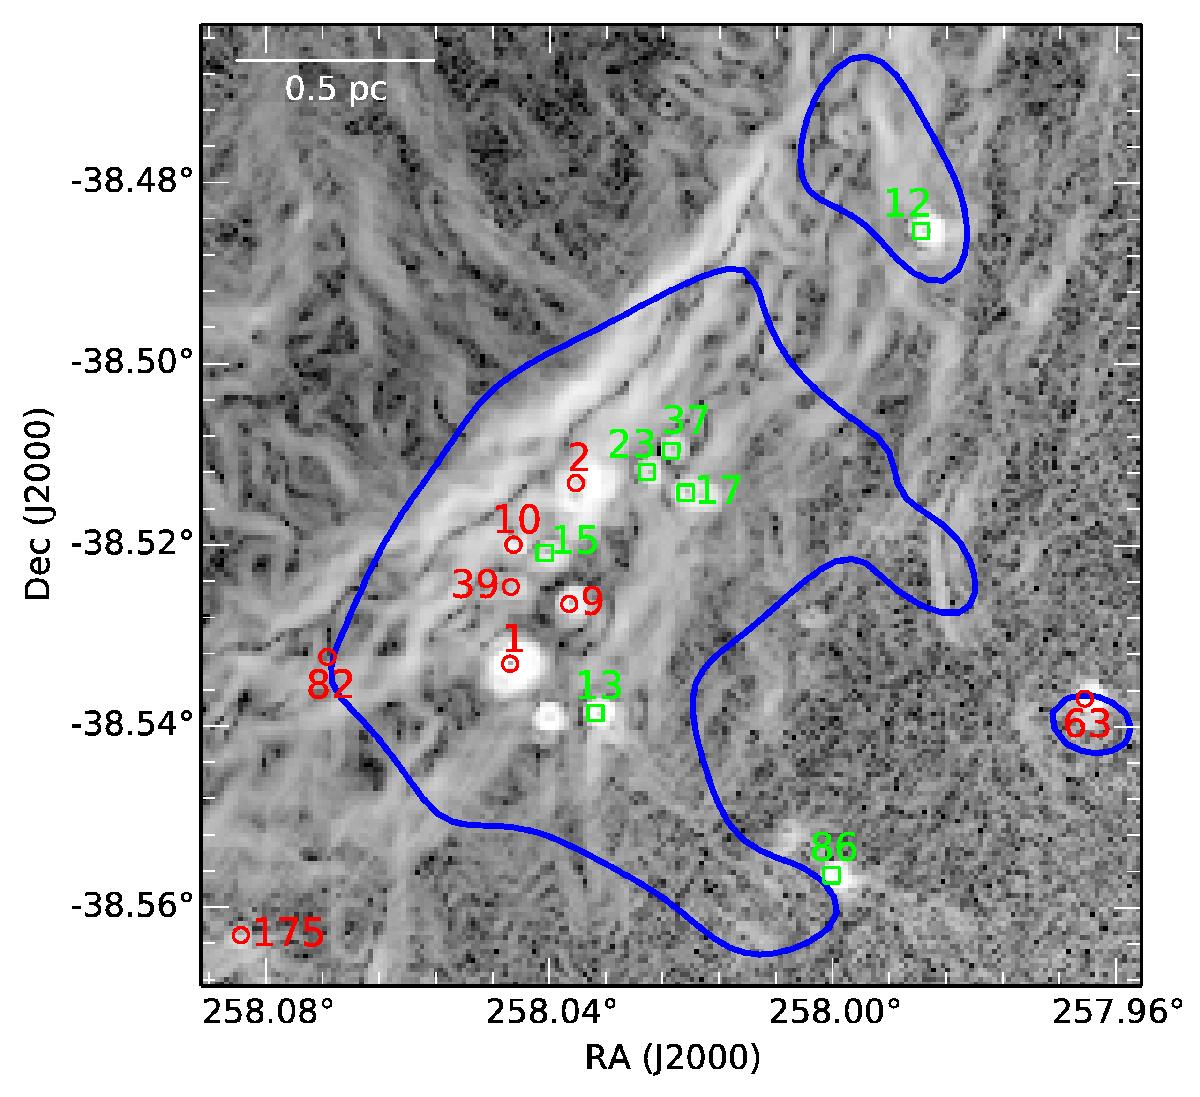
Condensation 1 and 7: 870 μm emission (countours) superimposed on the gradient image of the Herschel PACS 70 μm emission. Sources are identified with their getsources identification number. Sources coded with a red circle are those discussed (among the sample of 35 sources). The green square sources are detected but not discussed due to a lack of Herschel measurements (see text).
Current usage metrics show cumulative count of Article Views (full-text article views including HTML views, PDF and ePub downloads, according to the available data) and Abstracts Views on Vision4Press platform.
Data correspond to usage on the plateform after 2015. The current usage metrics is available 48-96 hours after online publication and is updated daily on week days.
Initial download of the metrics may take a while.