Fig. 16
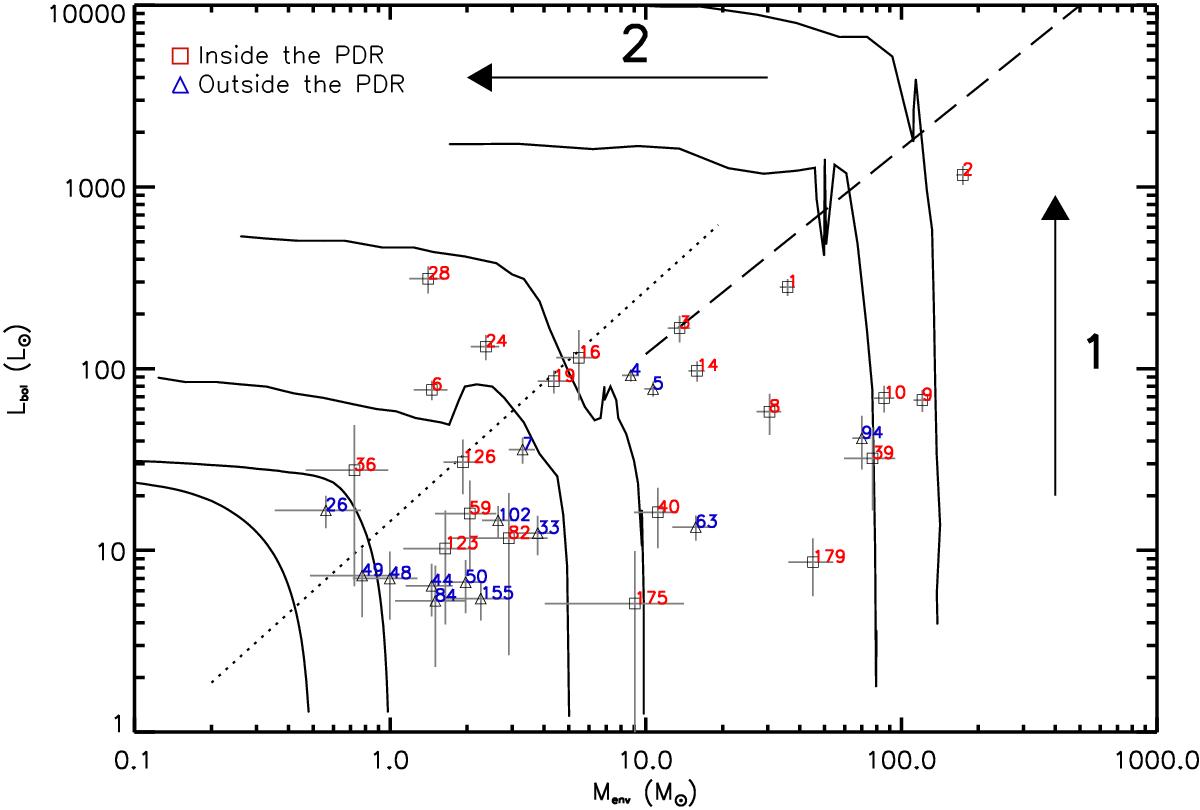
Lbol versus Menv. Evolutionary tracks are adapted from Saraceno et al. (1996) and Molinari et al. (2008). Labeled arrows indicate (1) the accreation phase and (2) envelope cleaning phase. Sources are coded as a function of their location with respect to the PDR: red squares sources are for the ones observed towards the PDR and blue triangles for those outside. Error bars for Lbol and Menv are shown by gray lines.
Current usage metrics show cumulative count of Article Views (full-text article views including HTML views, PDF and ePub downloads, according to the available data) and Abstracts Views on Vision4Press platform.
Data correspond to usage on the plateform after 2015. The current usage metrics is available 48-96 hours after online publication and is updated daily on week days.
Initial download of the metrics may take a while.