Free Access
Fig. 15
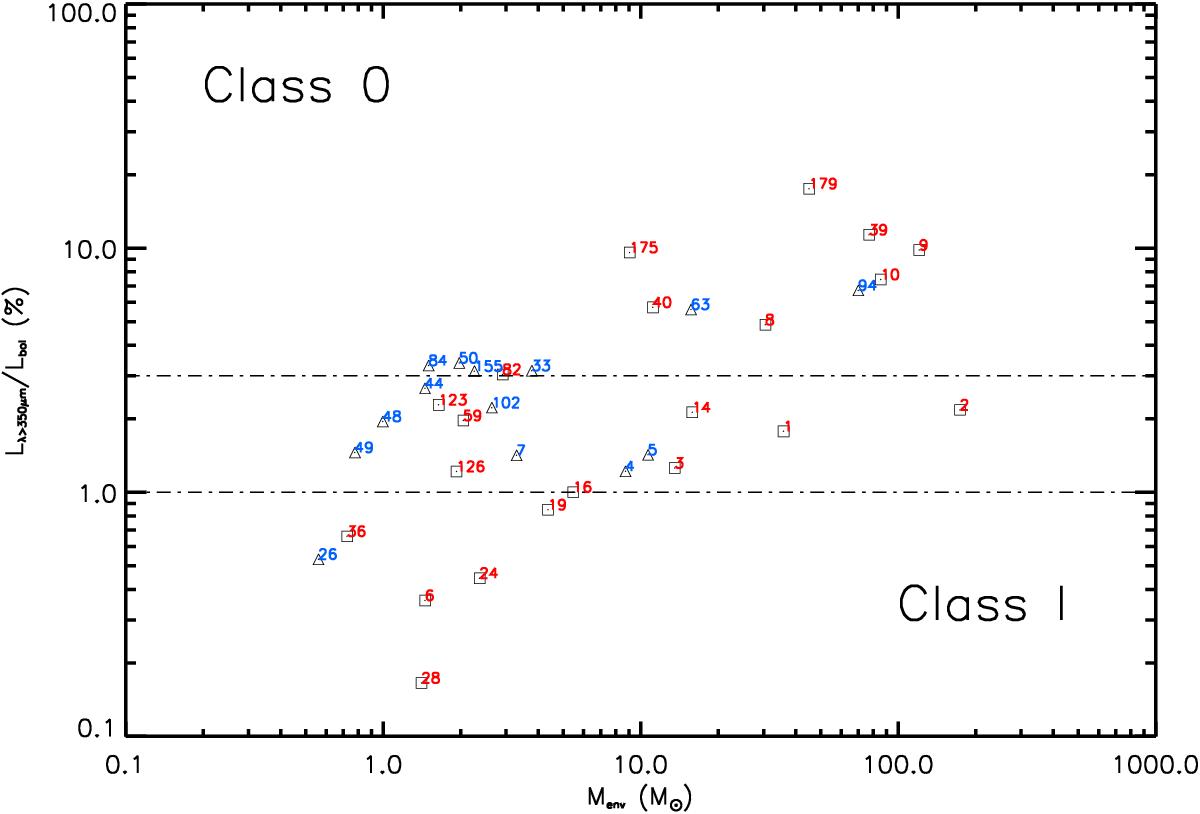
Lλ ≥ 350 μm/Lbol versus Menv. The dotted-dashed lines represents the Lλ ≥ 350 μm/Lbol limits between Class 0 and Class I from Bontemps et al. (2010a) and sources are color-coded depending on their location: red squares for sources inside the PDR, blue triangles for outside.
Current usage metrics show cumulative count of Article Views (full-text article views including HTML views, PDF and ePub downloads, according to the available data) and Abstracts Views on Vision4Press platform.
Data correspond to usage on the plateform after 2015. The current usage metrics is available 48-96 hours after online publication and is updated daily on week days.
Initial download of the metrics may take a while.