Free Access
Fig. 14
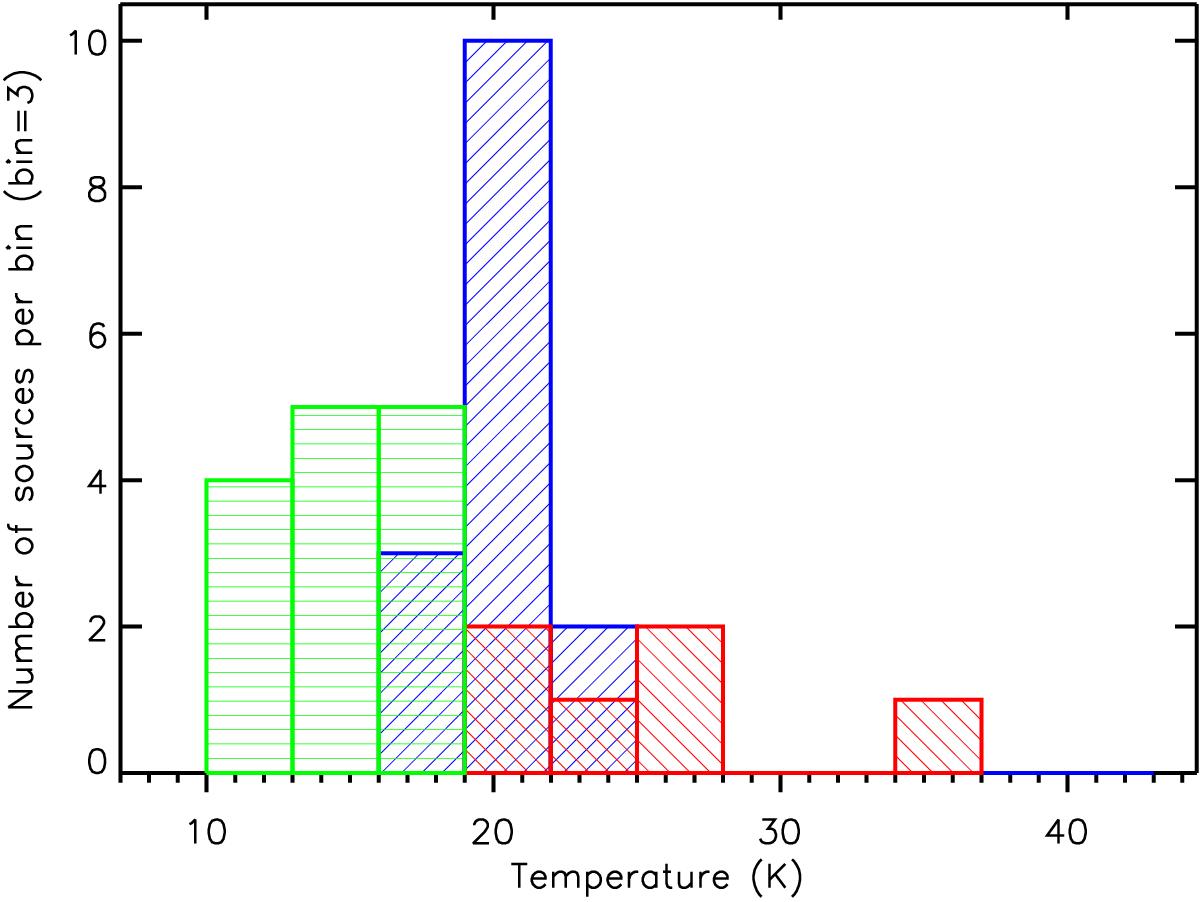
Histogram of the temperature color-coded according to Lλ ≥ 350 μm/Lbol in green for Class 0, red for Class I and blue for uncertain cases.
Current usage metrics show cumulative count of Article Views (full-text article views including HTML views, PDF and ePub downloads, according to the available data) and Abstracts Views on Vision4Press platform.
Data correspond to usage on the plateform after 2015. The current usage metrics is available 48-96 hours after online publication and is updated daily on week days.
Initial download of the metrics may take a while.