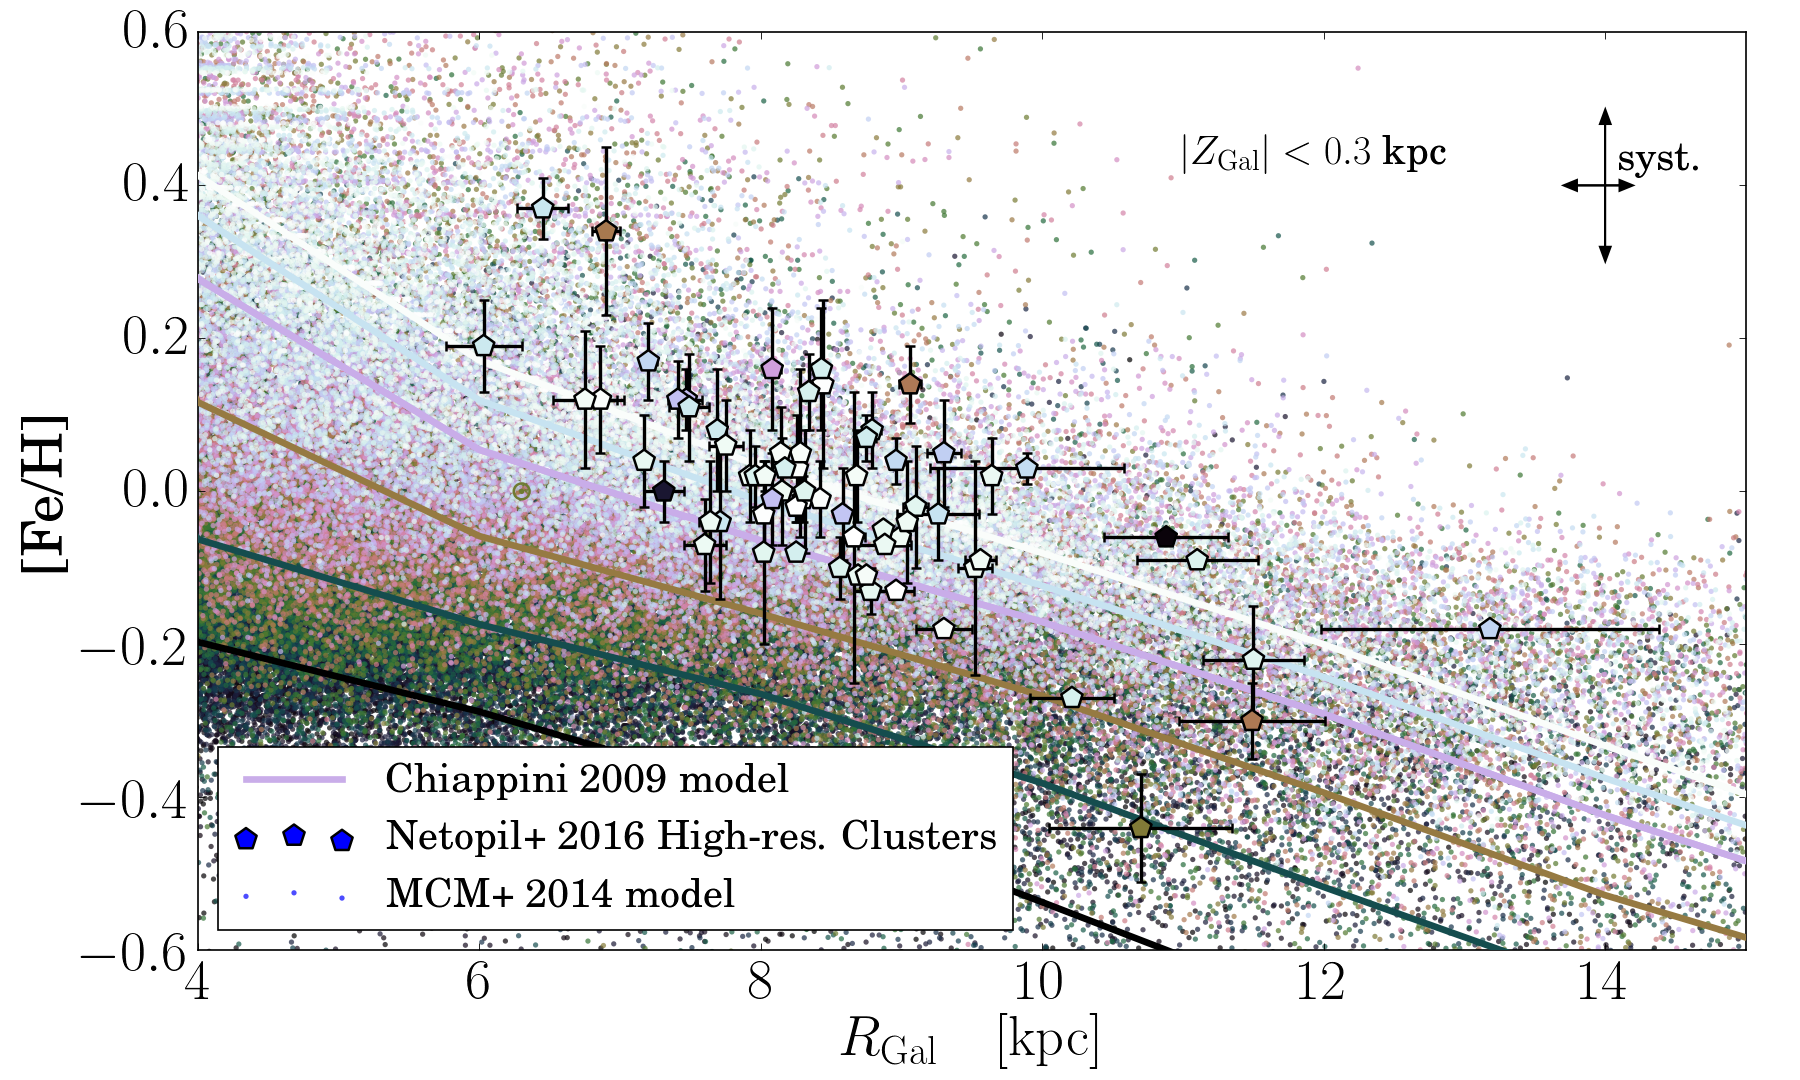
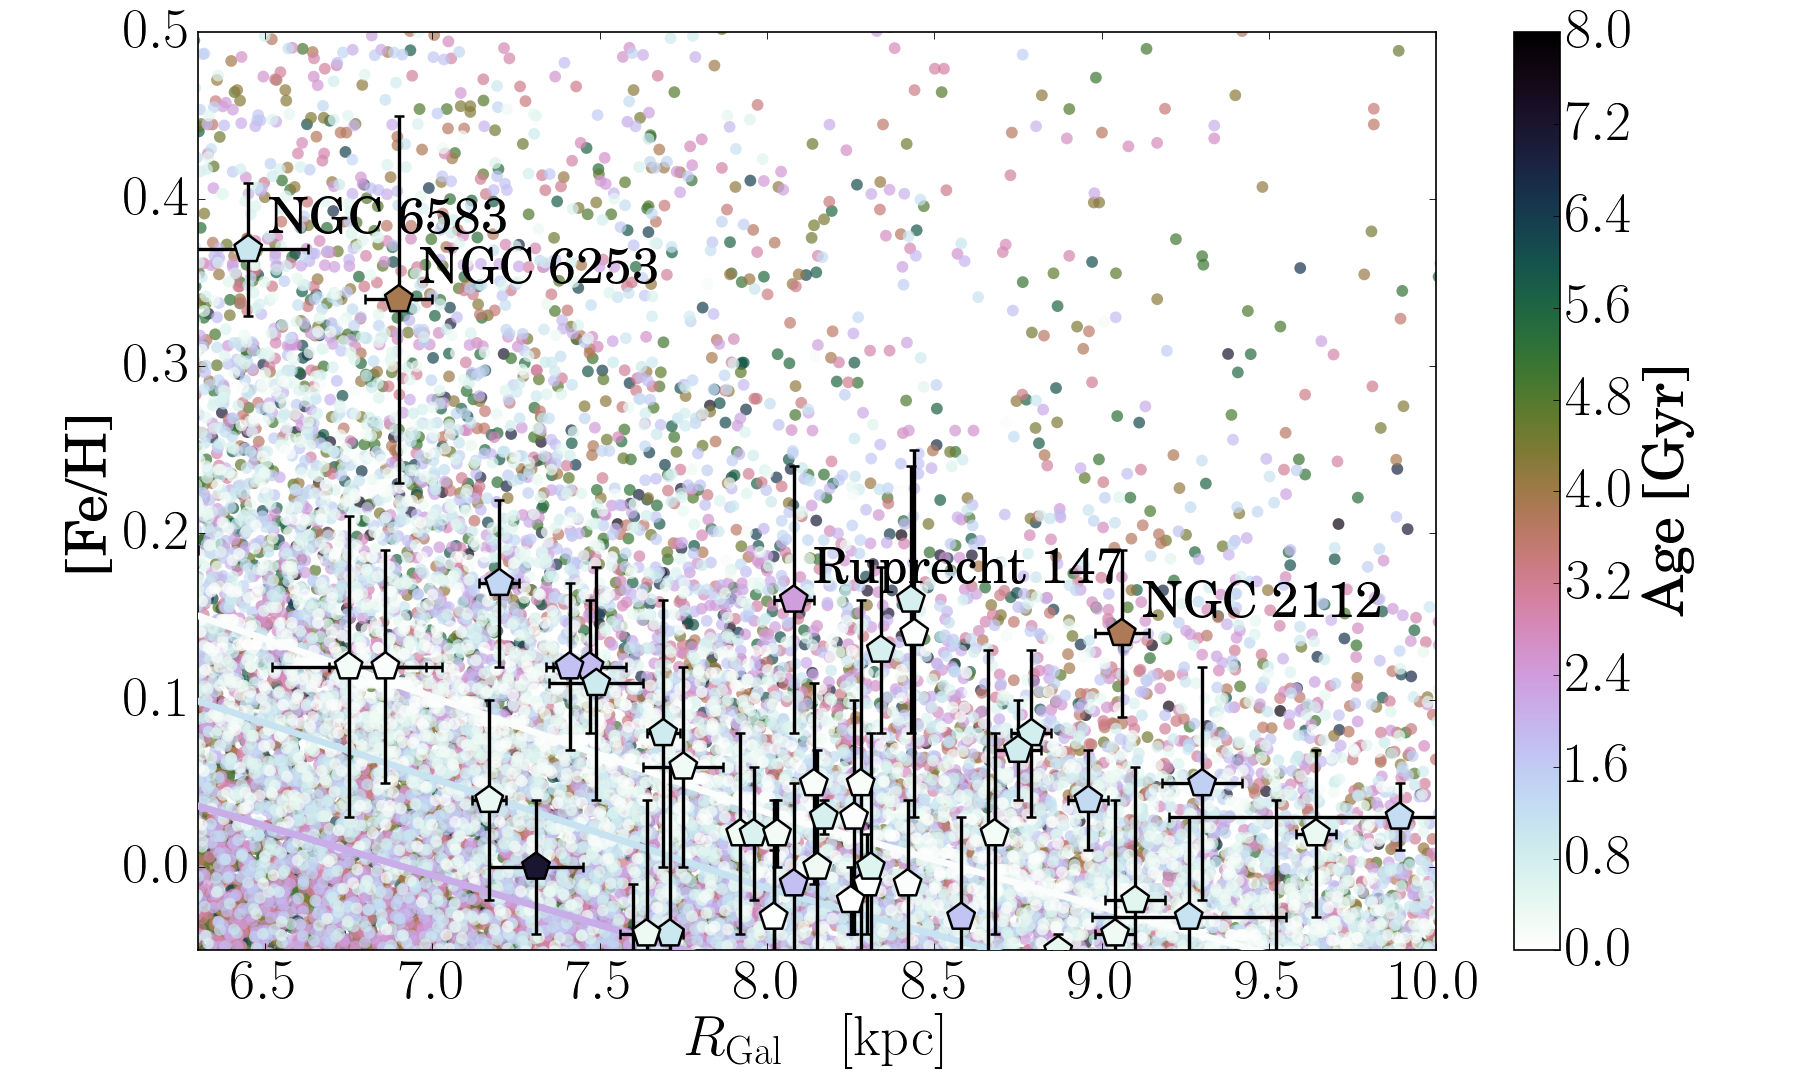
Fig. 6
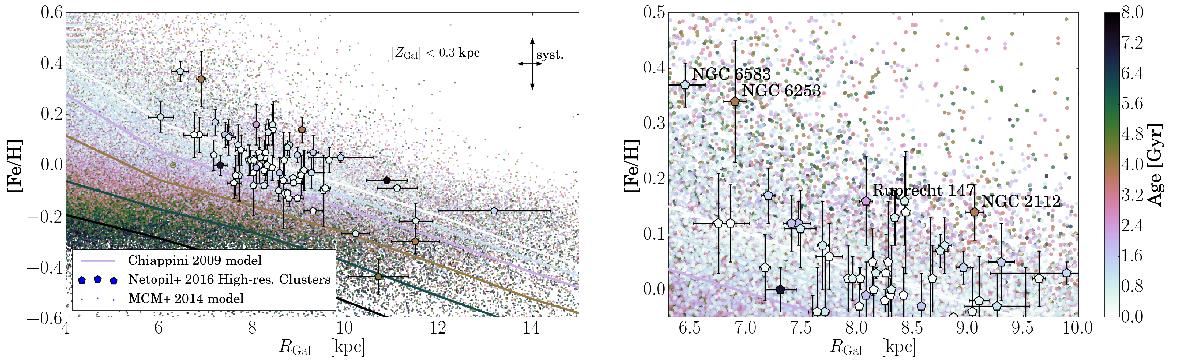
[Fe/H] vs. RGal distribution, colour-coded by age, for the high-resolution OC compilation of Netopil et al. (2016, pentagons), the MCM model close to the Galactic plane (| ZGal | < 0.3 kpc; small dots), and the Chiappini (2009) thin disc model at six time snapshots (thick lines). The models have now been scaled to the abundance scale of young OCs in the Netopil et al. sample, which is ≲0.1 dex lower than the Cepheid abundance scale of Genovali et al. (2014) used before. The arrows in the left panel symbolise the approximate uncertainties in the absolute metallicity scale and the distance to the Galactic centre. The right panel magnifies the interesting part of the left panel, such that it is clear that some older OCs have higher metallicities than both the younger ones and the local ISM. With the MCM model, these can be explained as surviving migrators from the inner disc.
Current usage metrics show cumulative count of Article Views (full-text article views including HTML views, PDF and ePub downloads, according to the available data) and Abstracts Views on Vision4Press platform.
Data correspond to usage on the plateform after 2015. The current usage metrics is available 48-96 hours after online publication and is updated daily on week days.
Initial download of the metrics may take a while.