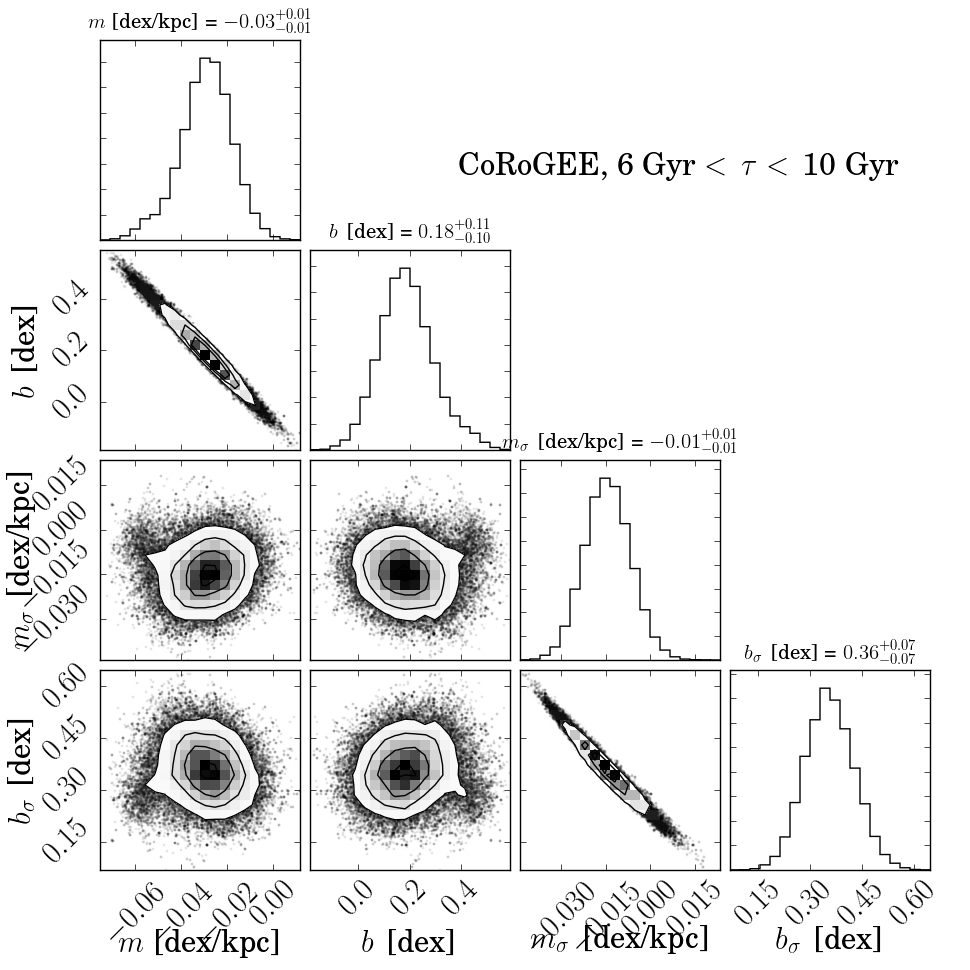
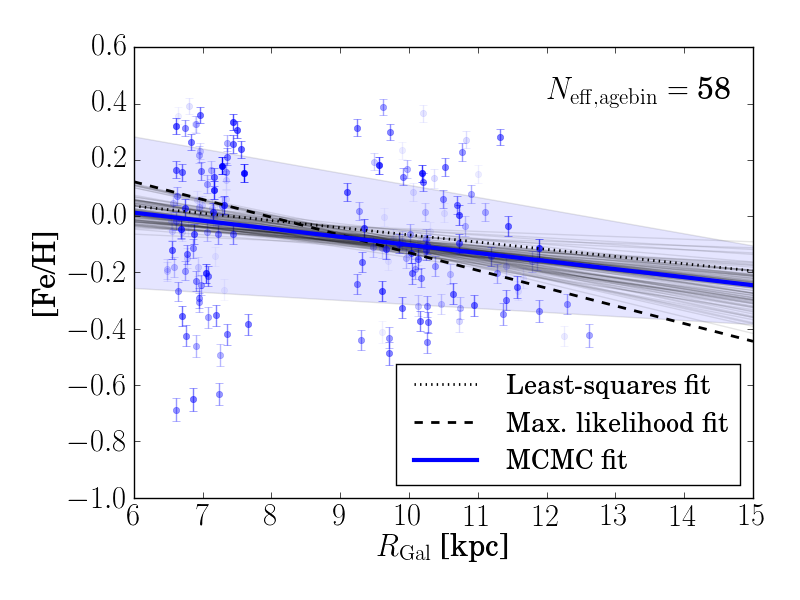
Fig. 2
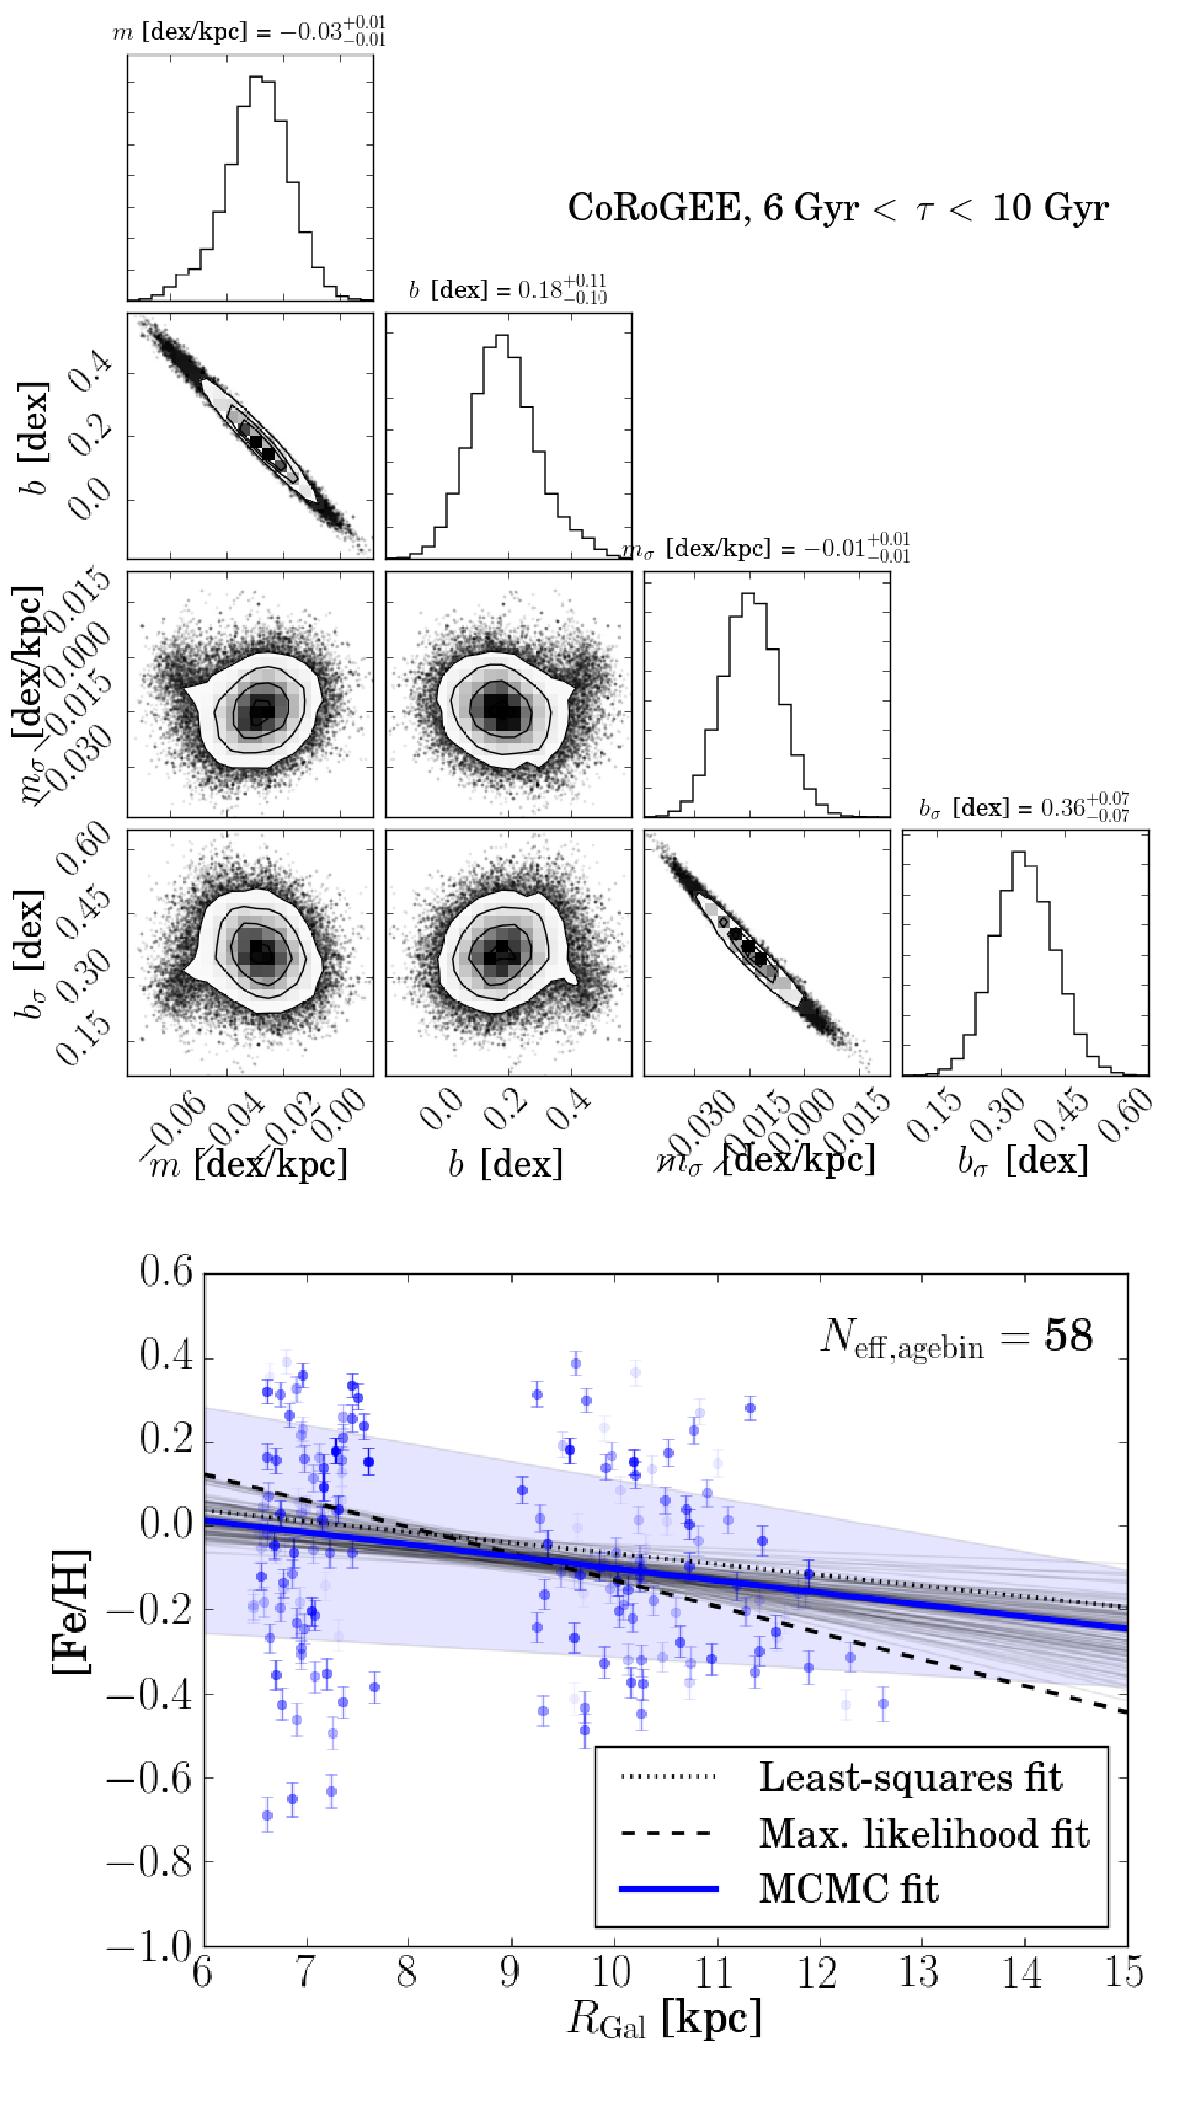
Top panel: “Corner plot” (Foreman-Mackey et al. 2016) showing an example of an MCMC fit result for the linear gradient + variable scatter model to CoRoGEE data, in the age bin 6 Gyr <τ< 10 Gyr. Histograms show the marginal posterior PDFs for the fit parameters (m,b,mσ,bσ); the density-scatter plots show the joint marginal posteriors. Bottom panel: resulting fit to the data in the RGal vs. [Fe/H] diagram. Faint grey lines show 50 MCMC samples; the thick blue line and the shaded band correspond to our best parameter estimates. For comparison, we also show the results of a least-squares linear fit (dotted line) and a maximum-likelihood fit (dashed line).
Current usage metrics show cumulative count of Article Views (full-text article views including HTML views, PDF and ePub downloads, according to the available data) and Abstracts Views on Vision4Press platform.
Data correspond to usage on the plateform after 2015. The current usage metrics is available 48-96 hours after online publication and is updated daily on week days.
Initial download of the metrics may take a while.