Fig. 1
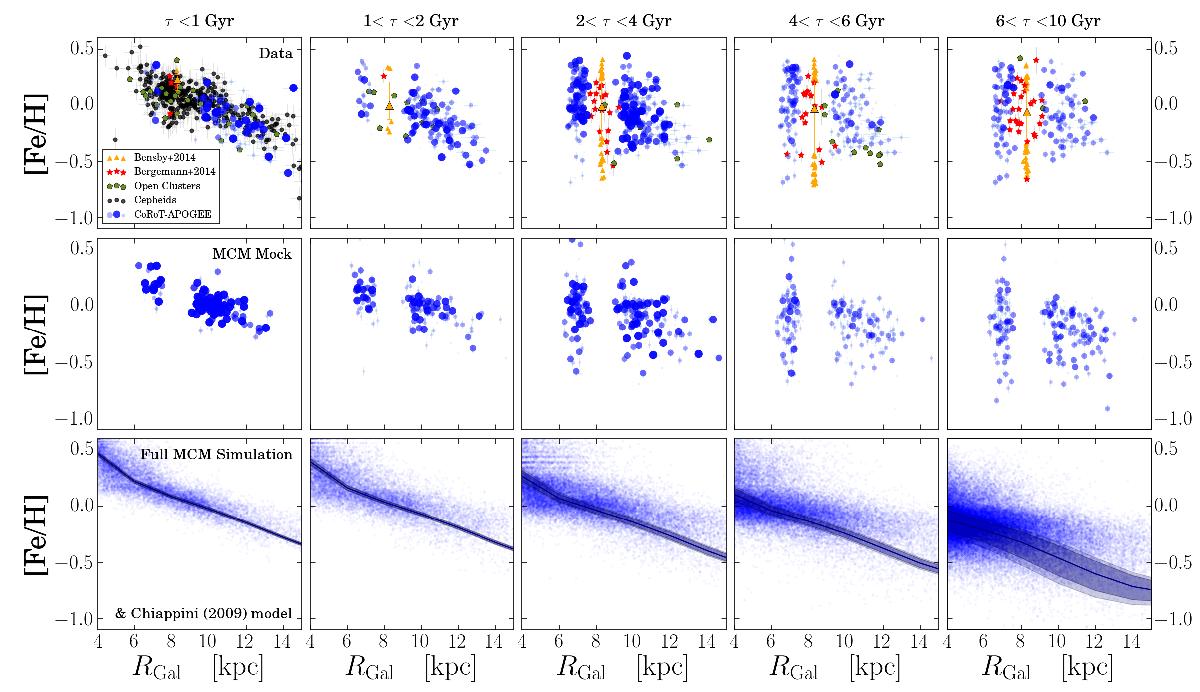
[Fe/H] vs. RGal distribution close to the Galactic plane (| ZGal | < 0.3 kpc) for five bins in age (from left to right, as indicated in each panel). Top row: data compilation. The CoRoGEE sample is shown in blue: for each star, we have calculated the fraction of the age PDF enclosed in each age bin – this fraction corresponds to the size of each dot and its transparency value. For comparison, we also show the open cluster compilations of Genovali et al. (2014) and Magrini & Randich (2015) as green pentagons, the subgiant sample from Bergemann et al. (2014, red symbols), and Galactic Cepheids (Genovali et al. 2014; black symbols). The solar-neighbourhood FGK dwarf sample of Bensby et al. (2014) is plotted as orange symbols: the large orange triangles and their error bars denote the median metallicities and the 68% quantiles, while small triangles represent stars that fall outside this range. Second row: mock CoRoGEE sample from the chemodynamical simulation of Minchev, Chiappini, & Martig (2013, 2014a, MCM), including typical observational errors in age, distance, and metallicity (Anders et al. 2017, 2016). Third row: full MCM simulation without errors, and the underlying chemical-evolution model of Chiappini (2009).
Current usage metrics show cumulative count of Article Views (full-text article views including HTML views, PDF and ePub downloads, according to the available data) and Abstracts Views on Vision4Press platform.
Data correspond to usage on the plateform after 2015. The current usage metrics is available 48-96 hours after online publication and is updated daily on week days.
Initial download of the metrics may take a while.