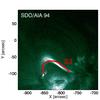
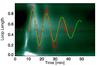
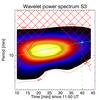
Fig. 9
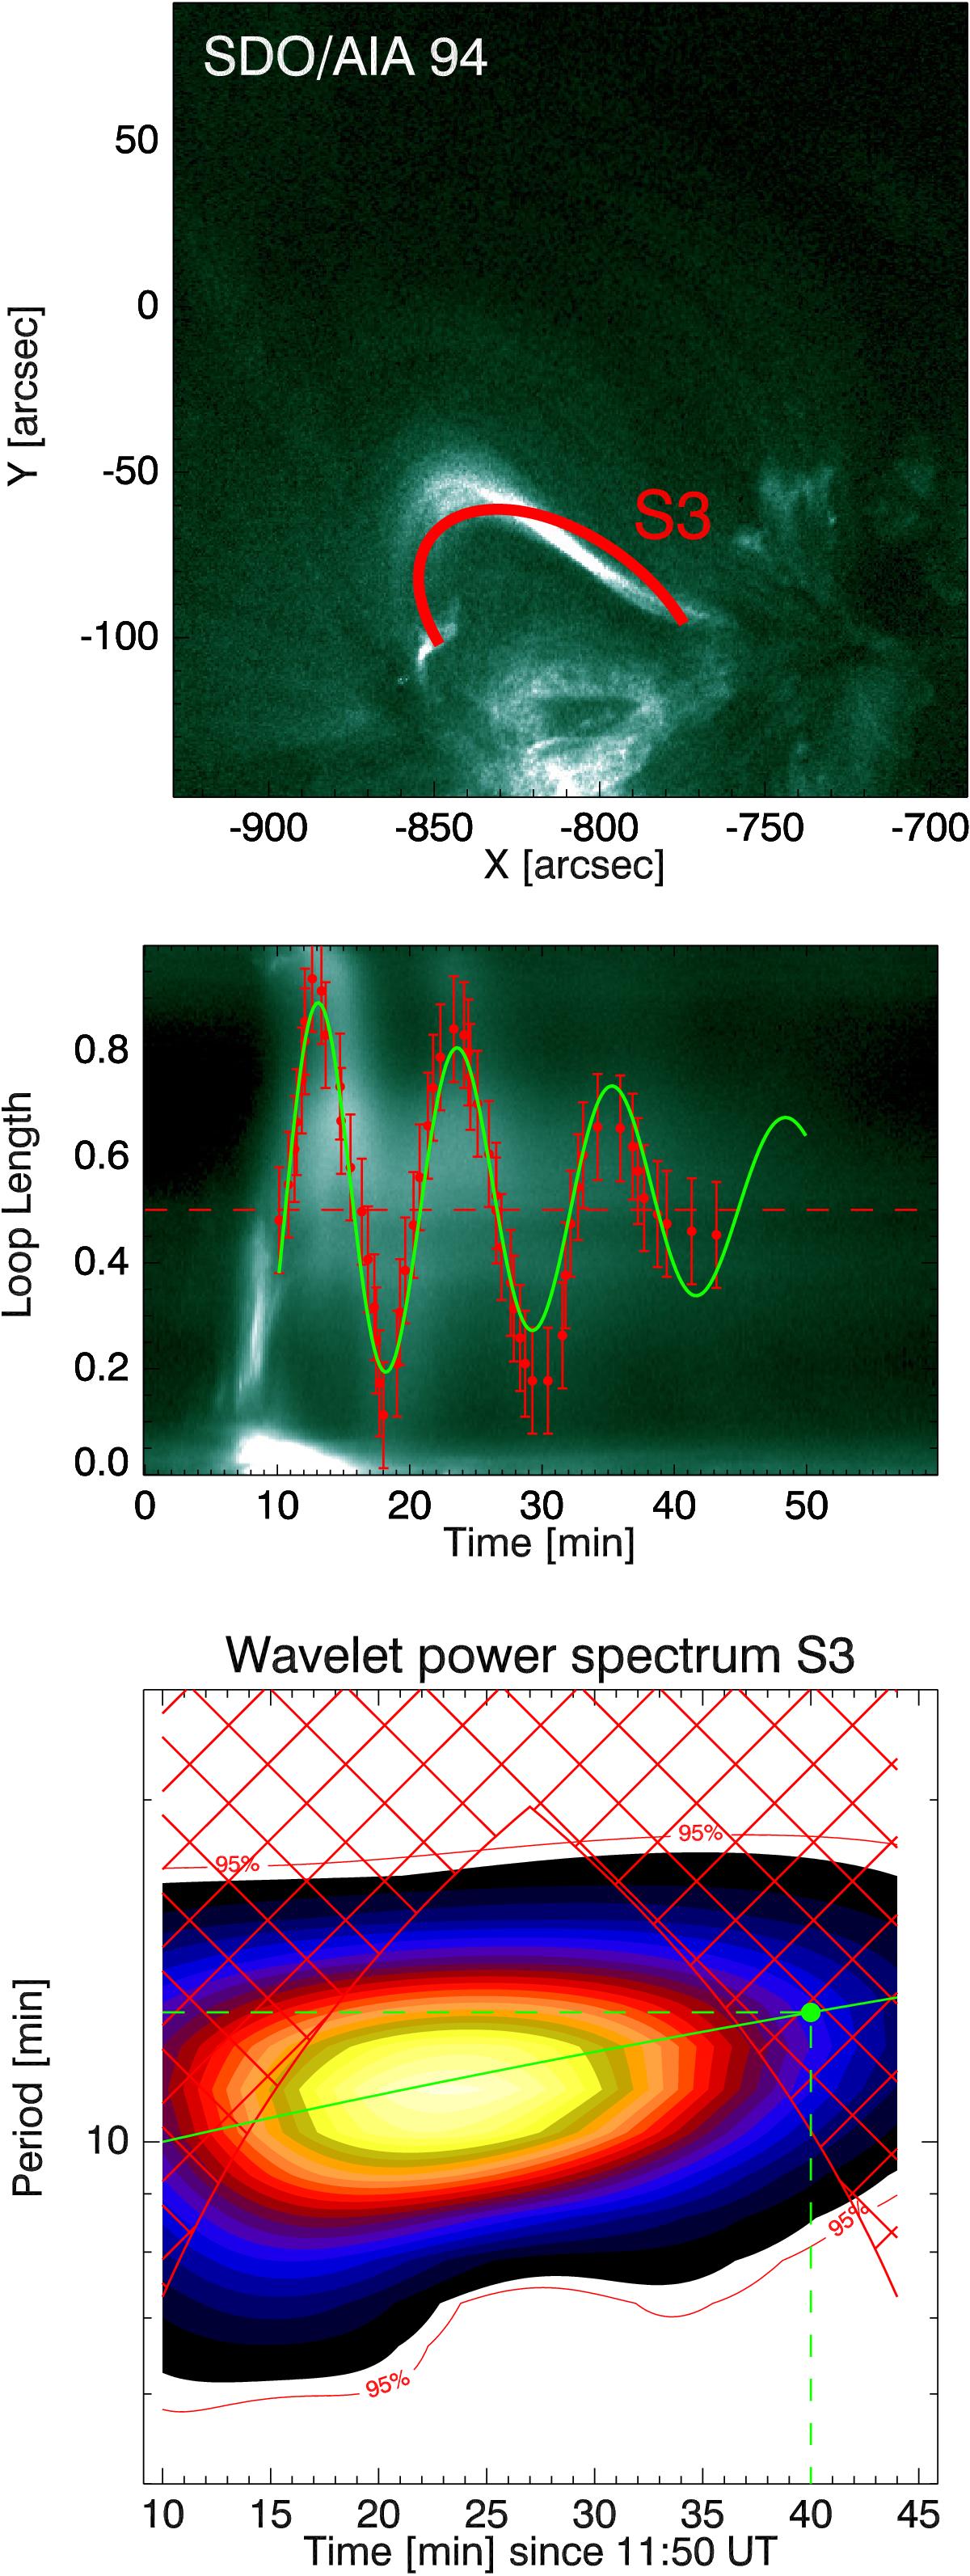
Top: image of the loop at 94 Å with the curved slit in red. Middle: TD maps from the curved slit. The red data points track the oscillation and are determined by eye. The oscillation in green is obtained by fitting the red points. Bottom: wavelet power spectrum of the oscillation profile. The green continuous line shows indicatively the rate at which the period of the slow wave varies (0.1 min min-1), while the green dot marks the value of the period (13 min) after 30 min from its excitation.
Current usage metrics show cumulative count of Article Views (full-text article views including HTML views, PDF and ePub downloads, according to the available data) and Abstracts Views on Vision4Press platform.
Data correspond to usage on the plateform after 2015. The current usage metrics is available 48-96 hours after online publication and is updated daily on week days.
Initial download of the metrics may take a while.