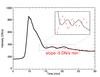
Fig. 8

Intensity time series in the AIA 171 Å band (bottom) starting at 11:50 UT, obtained from a boxcar centred on the cool plasma blob (top). The intensity shows a strong peak at the flare peak time, and then it drops very quickly in approximately 5 min. In the inset plot we show that the oscillations in the intensity profile (black) are in antiphase with the loop thread displacement (dashed red line).

Current usage metrics show cumulative count of Article Views (full-text article views including HTML views, PDF and ePub downloads, according to the available data) and Abstracts Views on Vision4Press platform.
Data correspond to usage on the plateform after 2015. The current usage metrics is available 48-96 hours after online publication and is updated daily on week days.
Initial download of the metrics may take a while.