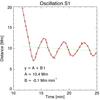
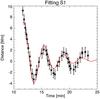
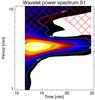
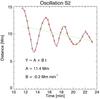
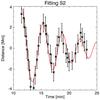
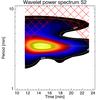
Fig. 7

Time series of the oscillations S1 and S2 (left), detrended oscillations with fittings in red (centre), and associated wavelet power spectra (right). The period is between 3.7 and 4 min. There is a very small variation of the period from the fitting analysis, however the green lines in the wavelet power spectra have a null slope.
Current usage metrics show cumulative count of Article Views (full-text article views including HTML views, PDF and ePub downloads, according to the available data) and Abstracts Views on Vision4Press platform.
Data correspond to usage on the plateform after 2015. The current usage metrics is available 48-96 hours after online publication and is updated daily on week days.
Initial download of the metrics may take a while.