Fig. 5
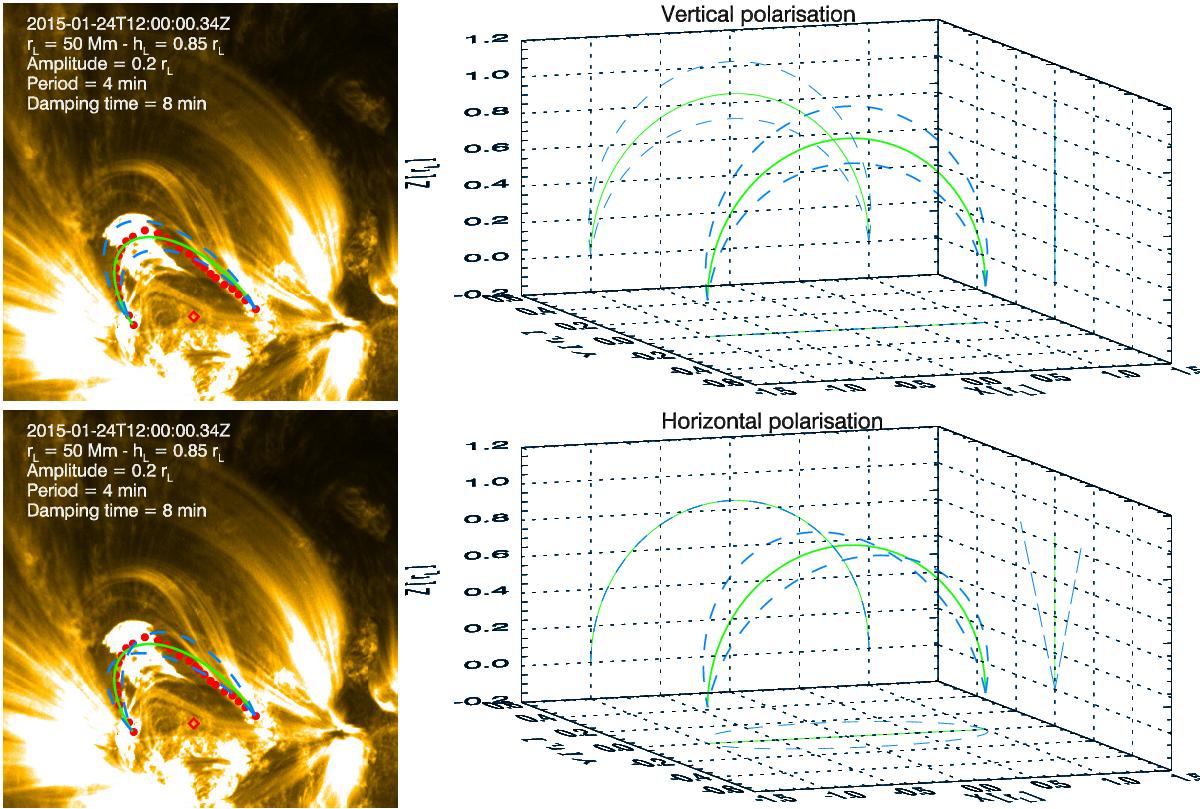
Top: vertical polarisation for the transverse displacements of the coronal loop threads. The right panel shows the model for a loop at the equilibrium (green line) in a 3D Cartesian coordinate system. The distance is measured in loop radius rL units. The shape of the loop at the oscillation extrema is represented by the dashed blue lines. The motion is on the xz plane. The left panel shows the projection of the loop model and its configuration at the oscillation extrema projected in the AIA 171 FoV at the time of the start of the kink oscillations. The red dots sample a single loop thread at the equilibrium, which is fitted by the loop model in green, and the red diamond is the loop centre on the solar surface. The movement direction of the loop model at the oscillation extrema matches that of the blob and the overall loop threads. Bottom panels: the same as described above but for the case of the horizontal polarisation mode. The motion is strictly on the xy plane (right panel), and the loop configuration at the oscillation extrema does not fit the observations well (left panel). Animations of the top and bottom panels are available in the two online movies.
Current usage metrics show cumulative count of Article Views (full-text article views including HTML views, PDF and ePub downloads, according to the available data) and Abstracts Views on Vision4Press platform.
Data correspond to usage on the plateform after 2015. The current usage metrics is available 48-96 hours after online publication and is updated daily on week days.
Initial download of the metrics may take a while.