Fig. 1
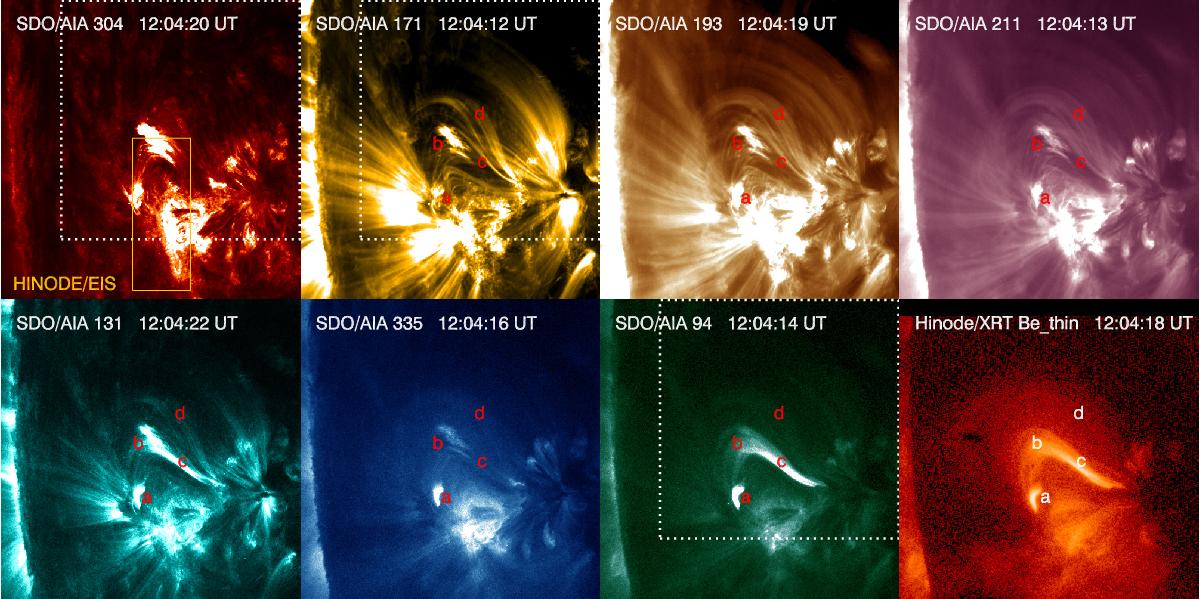
SDO/AIA and Hinode/XRT images of the AR NOAA 12268 on the 24th January, 2015, at the time of the flare event. The box in the 304 Å image shows the Hinode/EIS FoV. The labels indicate: a) a small post-flare loop at the site of the initial eruption; b) an expanding blob driving kink oscillations in the neighbouring loops; c) a bright loop observed distinctly at 131 and 94 Å; and d) overlaying unperturbed loops. The time evolution in the 171 and 94 Å as well as a composite of different channels is shown in a movie available online. The composite contains the bands 304 (red), 171 (green) and 94 Å (blue). The FoV of the movie is shown in the figure as a dotted square.
Current usage metrics show cumulative count of Article Views (full-text article views including HTML views, PDF and ePub downloads, according to the available data) and Abstracts Views on Vision4Press platform.
Data correspond to usage on the plateform after 2015. The current usage metrics is available 48-96 hours after online publication and is updated daily on week days.
Initial download of the metrics may take a while.