Fig. A.16
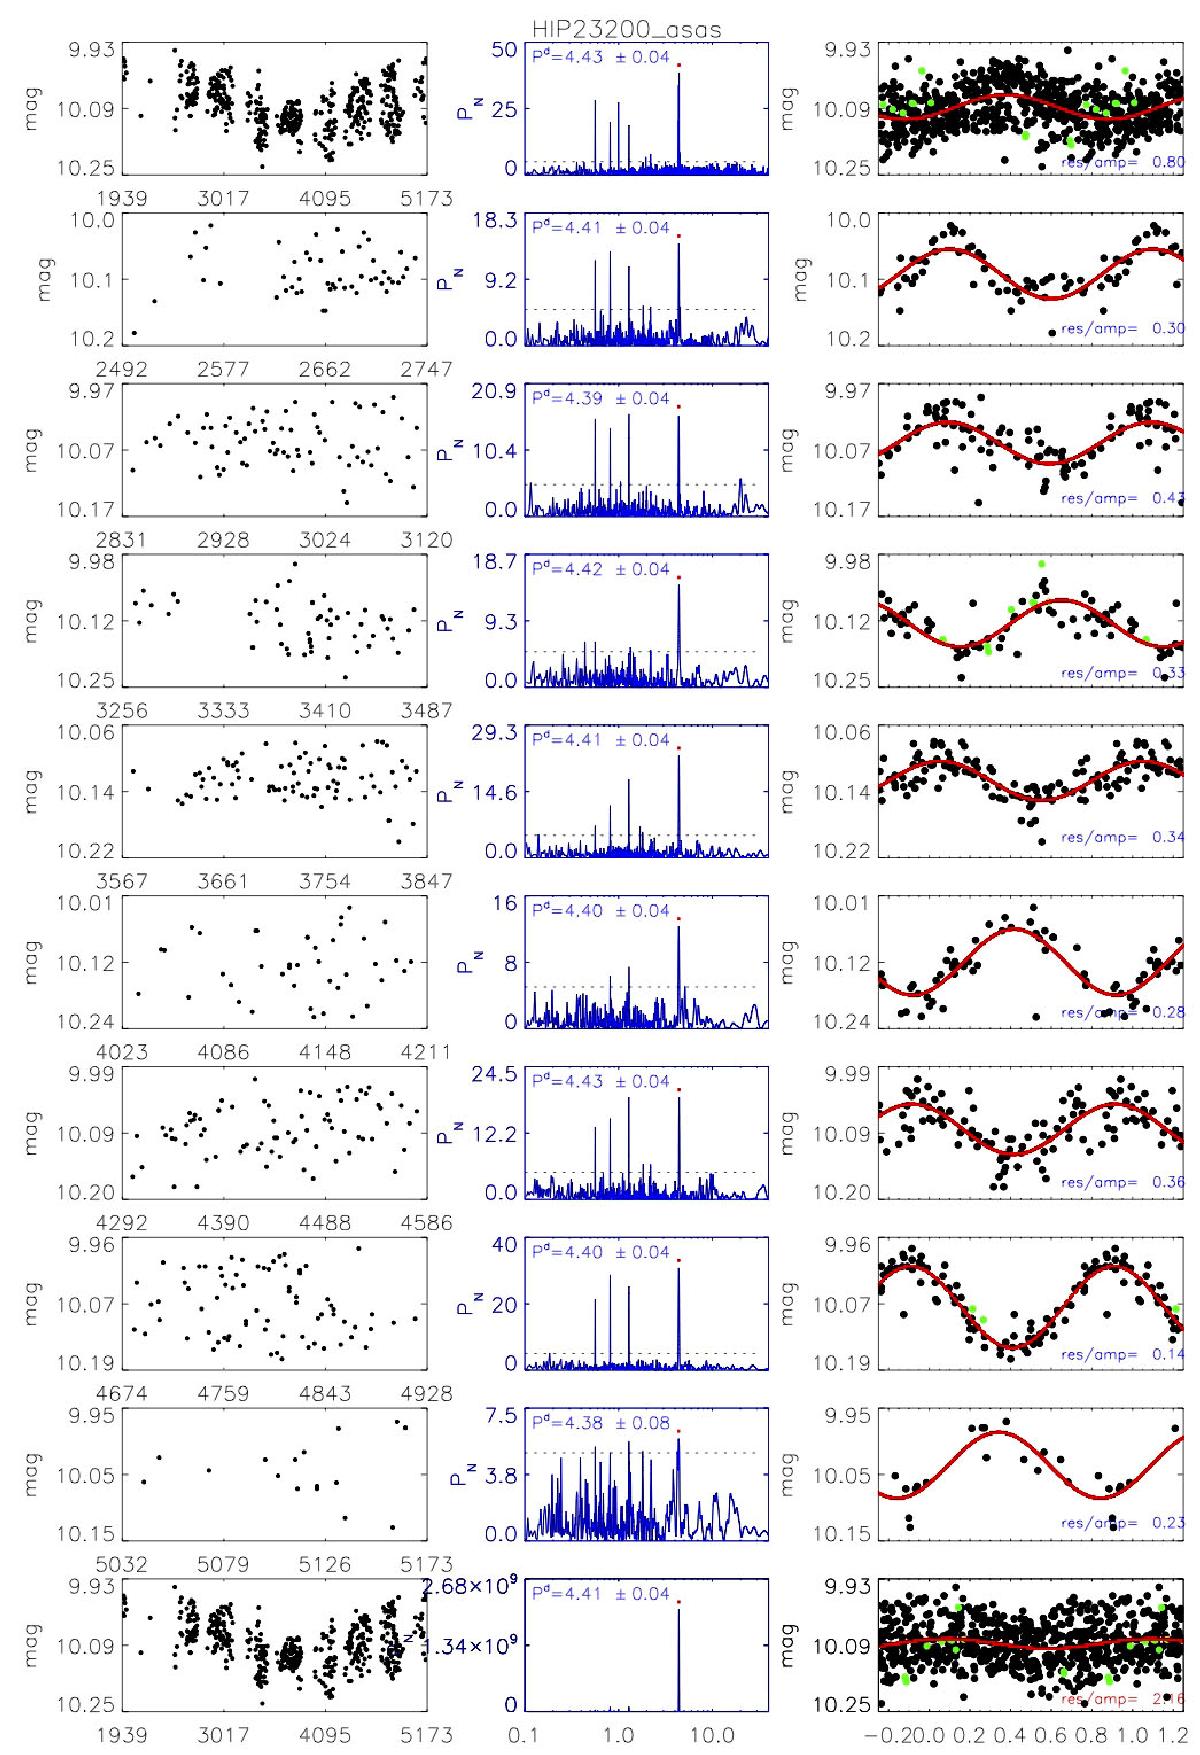
Results of the periodogram analysis for HIP 23200 with data collected by ASAS. Left panels show the V mag vs. HJD (−2450000.0); middle panels show the LS periodograms with labelled the rotation period; right panels show the light curves phased with the corresponding periods. Top panels refer to the complete time series, whereas the other panels to the seasonal light curves.
Current usage metrics show cumulative count of Article Views (full-text article views including HTML views, PDF and ePub downloads, according to the available data) and Abstracts Views on Vision4Press platform.
Data correspond to usage on the plateform after 2015. The current usage metrics is available 48-96 hours after online publication and is updated daily on week days.
Initial download of the metrics may take a while.